WordPress Vertical Scalability Part I: How Performance Varies with Changes in Hardware

How does your web application respond to improvements in the underlying hardware? Well, that will depend a lot on your application. Different applications are limited by different factors such as RAM, CPU, bandwidth, disk speed to name a few. In this article, I’ll show you an approach to finding out how to test your way to understanding how your application consumes resources.

At some point in the development cycle, preferably early, it makes good sense to narrow down what factors limit your application the most. It’s also useful to flip that statement around and ask yourself: what hardware improvements will benefit your overall performance the most? If you focus on the latter of the two statements, the solution is probably the most important information you need for good resource planning.

To demonstrate the concept of vertical scalability testing, (or hardware sensitivity testing), I’ve set up a very simple WordPress 3.8.1 installation and will examine how performance varies with changes in hardware. The tests are made using virtual machines where hardware changes are easy to make. I’ve created a simple but somewhat credible user scenario using the Load Impact User Scenario Recorder for Chrome.

The simulated users will:

  •  Surf to the test site
  •  Use the search box to search for an article
  •  Surf to the first hit in the search results
  •  Go back to the home page

The baseline configuration is very conservative:

  • CPU: 1 core
  • RAM: 128 Gb
  • Standard disks.

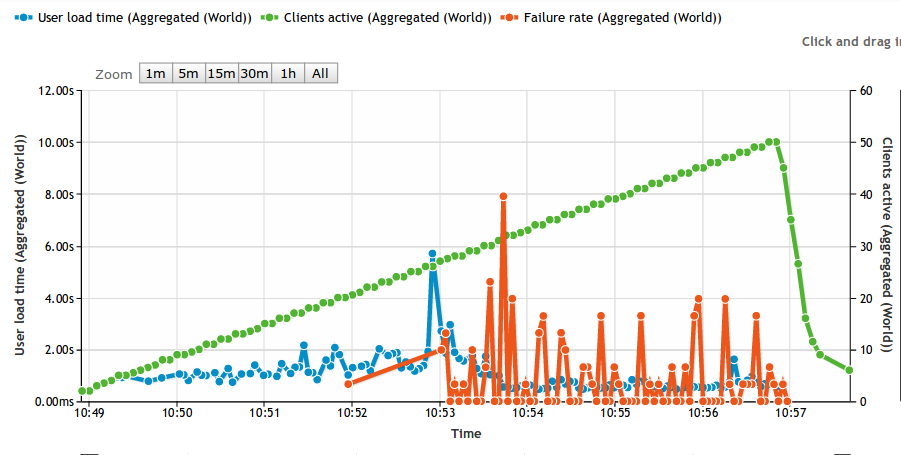
The test itself is a basic ramp up test going from 0 to 50 concurrent users. Based on experience from previous tests with WordPress, a low power server like this should not be able to handle 50 concurrent users running stock WordPress. The idea is to run the test until we start seeing failures. The longer it takes before we see failures, the better. In the graph below, the green line is number of simulated users, the blue line is average response time and the red line is the failure rate measured as number of failed requests/s. As you can see, the first failed requests are reported at 20 concurrent users.

baseline

A comment on the response times (blue line) going down. At a high enough load, nearly 100% of all responses are error messages. Typically, the error happens early in the request and no real work is carried out on the server. So don’t be fooled by falling response times as we add load, it just means that the server is quick to generate an error.


RAM Memory sensitivity

First, I’m interested to see how performance varies with available RAM. I’ve made the point in previous articles that many PHP based web applications are surprisingly hungry for RAM. So let’s see how our baseline changes with increased RAM:

At 256 Mb RAM (2x baseline):

RAM256

At 512  Mb RAM (4x baseline)

RAM512


That’s a quite nice correlation. We see that the number of simulated users that can be handled without a failure is moved higher and higher. At 1024 Mb RAM (8x baseline) we actually don’t get any error at all:

RAM1024

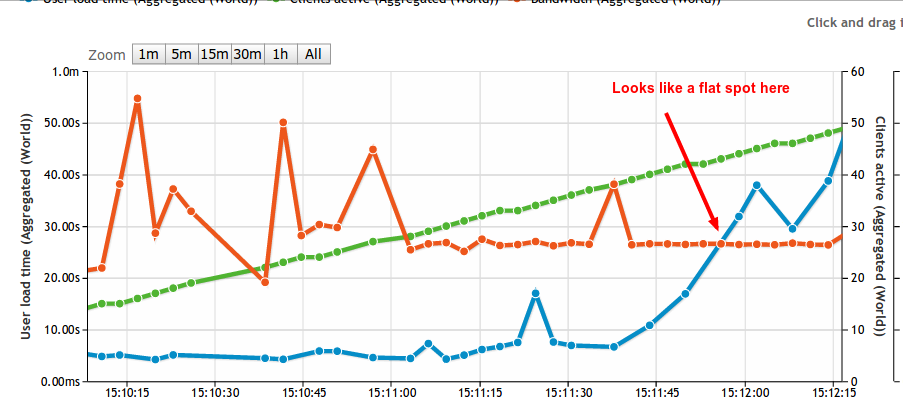
Also note that before the WordPress server spits out errors, there’s a clear indication on the response times. At a light load, any configuration can manage about 1s response time, but as the load increases and we’re nearing the point where we see errors, response times have already gone up.


Sensitivity to CPU cores

Next angle is to look at CPU core sensitivity. With more CPU available, things should move faster, right? RAM memory has been reset to 128 Mb, but now I’m adding CPU cores:

Using 2 CPU cores (2x baseline)

2xCPU

Ops! As you can see, this is fairly close to the baseline. First errors start happening at 20 concurrent users, so more CPU couldn’t do anything to help the situation once we run out of memory. For the sake of completeness, looking at using 4 CPU cores shows a tiny improvement, first errors appear at 23 concurrent users instead of 20.

Using 4 CPU cores (4x baseline)

4xCPU

Adding more CPU cores doesn’t seem to be my highest priority.


Next step, mixing and matching.

You’ve probably already figured out that 128 Mb RAM is too little memory to host a stock WordPress application. We’ve discussed WordPress specifically before and this is not the first time we realize that WordPress is hungry for RAM. But the point of this article wasn’t about that. Rather, I wanted to demonstrate a structured approach to resource planning.

In a more realistic scenario, you’d be looking for a balance between RAM, CPU and other resources. Rather than relying on various ‘rules of thumb’ of varying quality, performing the actual measurements is a practical way forward. Using a modern VPS host that let’s you mix and match resources, it’s quite easy to perform these tests. So the next step is your’s.

My next step will be to throw faster disks (SSD) into the mix. Both Apache/PHP and MySQL benefits greatly from running on SSD disks, so I’m looking forward to seeing those numbers.

Comments, questions or criticism? Let us know by posting a comment below:

——-

0b59bcbThis article was written by Erik Torsner. Erik is based in Stockholm, Sweden, and shares his time between being a technical writer and customer projects manager within system development in his own company. Erik co-founded mobile startup EHAND in the early 2000-nds and later moved on to work as technology advisor and partner at the investment company that seeded Load Impact. Since 2010, Erik manages Torgesta Technology. Read more about Erik on his blog at http://erik.torgesta.com or on Twitter @eriktorsner.


Code sample for automated load testing

In the previous post about automated load testing, we didn’t have the room to include a proper sample. So that’s what this post is going to be about. The complete code sample can be found here https://github.com/loadimpact/loadimpactapi-samples

A few comments if you want to try it out:

At the beginning, we net to set token and test id. If you haven’t already done so, you can generate an API token on your accounts page https://loadimpact.com/account/. Please note that the API token is not the same as the server metrics token. The next thing is to find the test configuration id that you want to run.

test_config_buttonAssuming that you already have an account and at least one test configuration created, you just go to your test configuration list and click on the test you’re interested in running. The URL will say https://loadimpact.com/test/config/edit/NNNNN where NNNNN is your test id. At the top of the test script, you find the two variables that you need to update. $token and $test_config_id.


$token = 'aaaaaaaaaaaaaaaaaaaaaaaaaaaaaaaaaaaaaaaaaaaaa';
$test_config_id = 1234567;
$verbose = TRUE;

Then, the interesting part of the script is quite straightforward:

$resp = loadimpactapi("test-configs/$test_config_id/start", 'POST');
if(isset($resp->id)) {
 $test_id = $resp->id; // The Id of the running test.
 $running = TRUE;
 $status = loadimpactapi("tests/$test_id", 'GET');
while($running) {
 if($verbose) echo "Test $test_id is {$status->status_text} \n";
 if($status->status > 2) { 
 $running = FALSE; 
 break;
 }
 sleep(15);
 $status = loadimpactapi("tests/$test_id", 'GET');
 }
// At this point, a status code != 3 would indicate a failure
 if($status->status == 3) {
 $jsonresult = loadimpactapi("tests/$test_id/results", 'GET');
 $timestamps = resulttoarray($jsonresult);
 echo responsetimeatmaxclients($timestamps) ."\n";
 }
} else {
 echo "Test $test_config_id failed to start \n";
}

Start the test, wait for it to finish and do something with the results. It’s really only the last part, ‘do something’ that’s deserves commenting on.

The LoadImpact API will return it’s data as two time series by default (you can ask for other time series as well). Basically, each of these two are a series of observations made during the test at given time intervals. The first series is the number of active clients seen at any given time. The other series represents the average response time from the test target. The two time series are synchronized via the timestamps (UNIX epoch). The code on github includes a function that massages these two time series into a single array of timestamps. At each timestamp, we can see number of active clients as well as the response time. So in the sample, I first run resulttoarray($jsonresult); so that I get an array that is easier to work with. Then I call responsetimeatmaxclients($timestamps) to find the response time found at the highest load during the test.

At the and, the return value is simply echoed to StdOut. Running the script, I’d get something like:


erik@erik-laptop$ php test.php
Test 1234567 is Created
Test 1234567 is Initializing
Test 1234567 is Running
Test 1234567 is Finished
3747.78

Since I’ve left $verbose=TRUE, I’ll get some status messages in the output. In a real scenario where the output is likely to be handled by a script, set $verbose=FALSE so that you just get the actual measurement back to StdOut.

Questions? Ideas? Opinions? Leave a comment below, we love to hear from you.

Bandwidth limited websites

What’s holding you back?

When you hit the limits of how much load your website can handle, you almost always want to know what it is that is holding you back. You already know that you’ve reached the limit, but what part needs to be changed in order to go higher?

The more load a web site gets, the more resources it’s going to consume. One of the many types of resources that the server needs to function will run out before the others. Sure, an extremely well balanced server setup will run out of all types of resources at the same time, but that’s probably not very common. To figure out what resource type that is causing the bottle neck, you need to look a different things. Loadimpact.com offers several interesting performance metrics that will reveal what’s holding you back. Then of course, as soon as you fix that, the next bottleneck is going to become visible, but that’s another blog post.

In this post, I’ll share some information about how you can determine that your web site performance is held back by bandwidth issues and a bit about what you can do to solve it.

How do I know it’s the bandwith?

Depending on where you host your web site, you may have access to tools and graphs from the hosting company that can give you a lot of information. But assiming that you don’t have that tool available, let’s look at how you can use Loadimpact.com to tell.

To be able to show you, I created a very simple web site that is very very bandwidth limited. The website contains one single .html file, absolutely no Python, PHP, Java, Perl or anything similar involved at all. The one file is called heavy.html and contains roughly 16Mb of the letter A. When lots of concurrent user requests heavy.html, a lot of bits will have to leave the web server all at the same time. This is the graph from the test (click to enlarge):

bandwidth

The graph reveals two interesting things. First of all, if you didn’t know already, you can add more than the two standard data series to your Loadimpact graphs. By default, Loadimpact will give you number of active clients and average response time. In this case, I’ve added the Bandwidth data series.

Second. The bandwidth graph pinpoints exactly what I was hoping for. That the bandwidth usage actually hits a plateau at roughly 70 Mbit/s. This means that somewhere between the software on my test server and the software on the measuring probe, there’s a bandwidth limitation of about 70 Mbit/s. It’s important to point out that this result doesn’t point out the exact location of that bottleneck, it just tells you it’s there. To make sure that you have a bottleneck in actually in your hosting environment, you should run the same test from different test servers. Loadimpact currently offers 8 different load zones, each load zone is in a different geographic location. Make sure you run tests from different load zones, or even more interesting, add 4-5 load zones into the same test. If you can still see your plateau at the same bandwidth usage, you can be fairly sure that you’ve found your limit.

And don’t worry if you’ve already run a series of tests using Loadimpact and didn’t add bandwidth to the graph. The data is still stored on our servers and you can add bandwidth when looking at older tests as well. So you might already have interesting data to analyze.

Ok, so what do I do about it?

If you are held back by bandwidth limitation, next step is obviously to try and do something about it. There are many potential ways you can bring down the bandwidth need.

Use compression

Make sure you use compression like gzip or deflate. By compressing the content before it’s sent from the server to the browser, you pay with some CPU resources to gain a little bandwidth. It’s safe to enable since the server will only send compressed content if the browser says it can handle it. Check if your web site uses compression with our Page Analyzer service. Enter the URL you want to test and when the result comes back, click the green plus sign to expand:

expand

Check for the Content-Encoding header in the response:
compressed_ok

Minify things

By removing white space from all static content such as javascript and css files, you can gain some bandwidth Minifying is most often done in your web application software rather, so how to do it depends on what type of Web application you are running. Read more about minifying here: http://wpmu.org/why-minify/

Reduce image quality

It may sound backwards, but a lot of web sites are sending images to the browser in 300 DPI, that’s great if the user want’s to print the image, but most images are just displayed on the actual web site where 72-96 DPI is sufficient. Not that the very term DPI means that much on web pages, but it still. A good text about the why and how is found here http://www.webdesignerdepot.com/2010/02/the-myth-of-dpi/

Have your cache settings correct.

In a test such as the one in this post, I didn’t want caching to happen because I wanted to illustrate something. If caching had been enabled, the response headers in the image above would have included an ‘Expires’ header. But in real life, you probably want your web server to instruct the browser to cache all static content. Correctly configured caching means that the browser wont download the same logotype, javascript and css files etc. every single time it loads a web page from your server. Google has written a bit about caching as part of their PageSpeed Rules. https://developers.google.com/speed/docs/best-practices/caching

Use a CDN.

A method that actually covers a lot of the above tips all in one is to use a content delivery network (CDN). A CDN provider will store your static content on their servers and serve it for you. Unless you are one of the bigger Internet companies, chances are that the CDN provider have more bandwidth available. They almost always also have more than one physical location, so that a user from Spain gets the content from a server in or near Spain while a UK user gets his content from a server in the UK. The end result is that the user gets his content faster and your server never have to see the traffic. The better CDN providers can also do some of the things like minifying of even image quality reduction automatically for you. So chances are that you end up saving both time and bandwidth.

That’s it

Opinions? Questions? Tell us what you want think in the comments below.

Load testing tools vs page speed tools

In a recent post, we talked about the difference between load testing tools and site monitoring tools. Another quite common question is what the difference is between Load testing tools and page speed tools. They both measure response time and they both are important when it comes to assess the performance of your web site. So what it the difference and which one do I need?

For most webmasters, the answer is probably that you need both. But before we talk about why, let’s try a car analogy.

Your own limousine business

Let’s say that you are the CEO of a limousine business. Every single day, you get a call from a client that wants to be picked up at the airport and taken to the city hotel. You send out one of your cars to pick the client up at the airport. The car navigates through traffic and safely leaves the client at the hotel he wanted to go to. Pretty easy.

Now, every now and then, your drivers report that the client wants to get to the hotel quicker and if your business can’t handle that, the client will switch to another limousine business. Since you don’t want to lose your customer, you take the feedback very seriously and start looking into what you can do about it. If you have any intention to do your work seriously, you’re probably going to start with measuring how long it actually takes to get the client from the airport to the hotel. A sensible thing to measure would be to look at the time elapsed from the client’s phone call until he is left of at his hotel. You also look into how long time it takes after the call until the  car is heading to the airport, how long time it takes to locate the client at the airport and how long time it takes to drive from the airport to the hotel.

After some careful analysis, you end up with a very good understanding of what takes time and you probably have a good idea about some of the things you can do to speed it up. Perhaps you decide to always have a car ready at the airport. You might want to change your stretch limousine car to a Ferrari or even to a motorcycle (an existing service in Paris among other cities) to make the actual trip a bit faster.  There’s a lot of different things you can do to make your service quicker. At some point, you are happy with the performance improvements and when you are, you have optimized your ability to take one client from one destination to another as fast as possible.

What does a limousine have to do with web pages?

Back to the subject of this article. A lot of web masters have received the same type of feedback as you did as CEO of the limousine service. But instead of complaining about how quick the clients gets to the hotel, they complain that your web page feels slow. And in reality, most of your clients won’t even complain, they’ll simply direct their browser to a different web site and never look back.

So, as a web master, you want to do the equivalent of measuring how fast your service is.  To do this, you want to get hold of a page speed measurement tool, and there are plenty to select from. The two most well known tools are Google PageSpeed Tools and Yahoo! YSlow, they don’t stop at measuring the actual page load times, they also give you a lot of insight into what is considered good enough and what you can do to improve the page load speed.

As you begin to implement various fixes to improve your page load time, you most likely go back to your tool of choice and redo your measurements in an iterative process. At some point, you are happy with the performance improvements and when you are, you have optimized your ability to serve one page to one client as fast as possible.

A more complicated limousine service

In reality, the limousine service has a lot of different clients. Not all of them is a single person that want to go from the airport to the hotel.  Some clients is a single person that want to go from the train station to the hotel and another type of client is a party of 10 people that want to go from the hotel to the airport. And sometimes things gets really complicated, you get 100 clients calling pretty much at the same time wanting to go in all kinds of directions. For most business owners, having a lot of clients calling would be a nice problem, but it’s even more important to be able to keep the service level high, otherwise you just get a lot of disappointed clients, fast.

So, some of the optimizations you made to serve one client really quick will still be valid. Having cars waiting at the airport probably still makes sense, but should you really have a Ferrari or a motorcycle waiting there? Perhaps the stretch limousine that takes 10 passengers was a pretty good thing after all, or a mix? Clearly, this is a much more complicated thing to measure and optimize and to be honest, if I was the CEO of the limousine service, I would have to think hard to even know where to begin.

Load testing tools

The purpose of load testing tools is to help you simulate how your web site performs when you have a lot of clients at the same time. You will find out that some of the optimizations you made to make a single page load really quick makes perfect sense also when you have a lot of concurrent clients. But other optimizations actually makes things worse. An example would be database optimizations,  the very indexes that makes the web page super fast as long as the page only require good read performance may hurt you a lot when some client requests are writing to the same tables at the same time. Another example may be memory consumption. When one single web page is being requested, a script that uses a lot of memory can go unnoticed or even speed things up, but in a high load scenario, high memory consumption would almost certainly hurt performance when the web server starts to run out of memory.

So if I was a web master, I do have a pretty good idea where to begin when optimizing a web site for many concurrent users. I would start with a load testing tool.

Load testing tools vs page speed tools

Back to the original question. What is the difference between load testing tools and page speed tools and which one should I use? Again, the answer is that you probably should use both.

Fast loading web pages is crucial so you should absolutely use one of the page speed tools available. Web users turn their back to slow pages faster than you can type Google PageSpeed Tools in your search bar.  And the bonus is that a lot of the things you do to optimize single page load times are going to help performance also in high load scenarios.

Fast loading web pages that keep working when you have a lot of visitors is perhaps even more crucial. At least if your web business relies on being able to serve users. If you want to know how your web page performs when you have 10, 100 or even 10000 users at the same time, you need to test this with a load testing tool such as loadimpact.com/

Opinions? Questions? Tell us what you want think in the comments below.

About Load Impact

Load Impact is the leading cloud-based load testing software trusted by over 123,000 website, mobile app and API developers worldwide.

Companies like JWT, NASDAQ, The European Space Agency and ServiceNow have used Load Impact to detect, predict, and analyze performance problems.
 
Load Impact requires no download or installation, is completely free to try, and users can start a test with just one click.
 
Test your website, app or API at loadimpact.com

Enter your email address to follow this blog and receive notifications of new posts by email.