Saving Your Super Bowl Bacon: How One Advertiser Performance Tested Early and Avoided Disaster

SuperBowl2014__140201231903During Super Bowl  XLVII, Coca Cola, Axe, Sodastream, Calvin Klein had their hands full. Not so much serving online visitors as running around looking for quick fixes for their crashed websites. As reported by Yottaa.com, no fewer than 13 of the companies that ran ads during that Super Bowl saw their websites crash just as they needed them the most.

If anything in this world is ever going to be predictable, a large spike in traffic when you show your ad to a Super Bowl audience must be one of those things.

Thats why one leading digital agency – ROKKAN –  worked with us to guarantee the stability of their client’s campaign website just days ahead of their Super Bowl XLVIII TV commercial.

Getting this level of performance assurance not only eased their client’s concerns, it also showed how committed ROKKAN was to the quality of execution.

As with any advertising campaign, its not only about the glitz and glamour of the ad, its about the ability to motivate action on the part of the audience. And if that motivation is to visit a website, you better be damn well sure that website can take the heat and deliver an exceptional experience. Anything less translates to lost customers, degraded reputation and fewer sign ups – as was this advertiser’s campaign objective.

Background:

The auto industry was the biggest sponsor of the Super Bowl for the third straight year this year. No fewer than seven brands advertised during Fox TV’s telecast of the National Football League’s championship game on Sunday, February 2, 2014.

On average, the carmakers spend as much as $6 million per 30-second spot, for the chance to get in front of an estimated 100+ million viewers. 

“When these types of investments are made, if your website doesn’t work, it becomes very ugly, very quickly for all parties involved in the campaign,” said Jim Blackwelder, chief technical officer for ROKKAN, a Publicis Groupe company that’s done award winning work for American Express, jetBlue, Chipotle, Ceasars Palace, and TAG Heuer. “Everybody just expects technology to work these days, and if it doesn’t, everyone notices.”

Test setup:

The Super Bowl Sunday challenge for ROKKAN – a 2014 Advertising Age A-List Agency for the third consecutive year – could not have been clearer: the target user load for its automaker client’s microsite promoting the features of an upcoming luxury sedan, was over 250,000 visitors per hour coming in from across the country and around the world.  But initial performance tests of the website using Load Impact failed far short of that goal.

“That first test was a total eye-opener,” said Blackwelder.  “Load Impact showed us we had a lot of work to do to get performance where it needed to be.”

At the advice of Load Impact, ROKKAN split performance testing to separately hit the website run by the hosting company Rackspace. The tests were done by going through and around the Rackspace content delivery network (CDN) to uncover crucial performance and configuration issues with both scenarios.

Daily meetings and testing ensued. 

Challenges:

“The team at Load Impact realized that without a full court press – a really integrated effort with all of the stakeholders including ROKKAN, their service providers, as well as Load Impact – the success of the project was far from guaranteed,” said Charles Stewart, Load Impact’s general manager for U.S. operations. 

Solution:

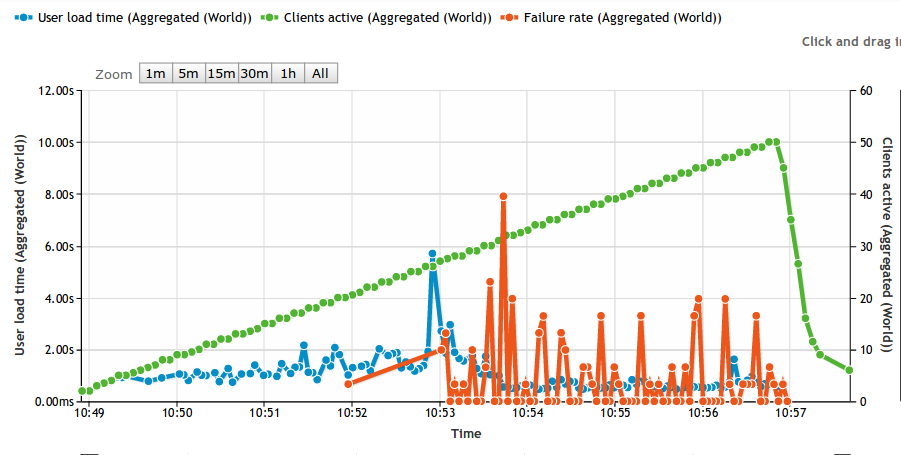
With less than one week from kickoff, ROKKAN made changes and optimizations to problems identified by Load Impact at the caching layer, application layer and hardware layer, that brought page load times to under 4 seconds with just over 10,000 simultaneous users.  

It was 20 times better than when they started, but still a long way from their goal. As an added complication, eleventh hour changes requested by the automaker adversely impacted performance dramatically.

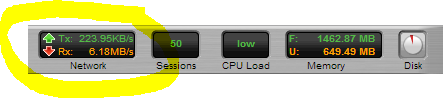
Load Impact and the ROKKAN team examined the data and identified network bandwidth as the likely cause of the performance degradation, and produced reports to support the findings.

With data in hand, Blackwelder was able to go to Rackspace’s network team, which quickly identified and resolved the remaining bottlenecks, increased throughput to the site, and gave ROKKAN’s platform the capacity it needed to scale.  

Results:

The automaker’s website was ready for game day.

“Had we not done performance testing we never would have uncovered a range of issues with both our work and our partners,” said Blackwelder. “Without Load Impact our hitting the project goals and schedule would have been at risk. But it wasn’t at all.  It was a huge success.”

The automaker’s site performed perfectly under the Super Bowl traffic, far exceeding expected connections per second without breaking a sweat, and delivered the customer sign-up conversions that were the automaker’s key success metric.

“For many of ROKKAN’s projects we thought of performance testing as a nice-to-have. But for this project and any of its type, it’s an absolute need-to-have. We needed large scale capacity testing, real-time viewing, and robust reporting, with a platform that could respond to change quickly, and Load Impact delivered on all counts.” – Jim Blackwelder. 

———–

This is a perfect example of how NOT to waste $4 million (not including production costs). If you’ve got a big marketing campaign coming up, make sure your audience can actually fulfill the action you want them to take – performance test your campaign website/app early. 

5 Ways to Better Leverage a DevOps Mindset in Your Organization

The last few years have given rise to the “DevOps” methodology within many organizations both large and small. While definitions vary somewhat, it boils down to this: breaking down silos between developers and operations.

This seems like a common sense approach to running a business, right?

While many organizations do have a DevOps mindset, I find myself regularly talking to IT staff where there is near zero collaboration between applications teams, network and security. In highly silo-ed organizations these teams can actually work against each other and foster significant animosity. Not my idea of an efficient and agile organization!

Organizations that use a DevOps mindset will deploy applications and capabilities significantly faster and with fewer operational issues from what the industry is reporting.  According to Puppet Labs:

High performing organizations deploy code 30 times more often, and 8000 times faster than their peers, deploying multiple times a day, versus an average of once a month.

It is extremely important that applications teams are creating code and applications in a way that can be properly supported, managed and operationalized by the business. Here are some tips to best leverage this type of approach in any organization:

1. It’s not (entirely) about tools

Everyone loves to buy new technology and tools.  The problem is that often times products are only partially deployed, and capabilities go unused and sit on the shelf. And if you think starting to use some new products and tools will make your organization DevOps enabled, think again.

Building a DevOps culture is much more about taking two parts of the organization whose roots are quite different and bringing them together with a shared vision and goal. Think about it: operations looks at change as the reason the last downtime occurred and App-Dev is constantly trying to evolve and elicit disruptive change. No product or tool is going to make this all happen for you. So start with this in mind.

2. Communication and goals are absolutely critical

This is going to sound really obvious and boring, but if your ops and apps teams are not communicating – not working towards a shared set of goals – everyone is vested if you have a problem.

Defining what the organizational goals are in terms of real concrete objectives that meet the SMART criteria is the right place to start.  I’ll bet most organizations do not have goals that meet this level of specificity so I’ll provide a good and bad example:

  • Bad goal: “We want to be the leader in mobile code management”
  • Good goal: “We will be the leader in mobile code management by June 30th of 2015 as measured by Garnter’s magic quadrant, with revenues exceeding $25m in 2Q 2015″

See the difference?  Even the casual observer (who doesn’t even know what this fictitious space of mobile code management is) could tell if you met the second goal. Great. Now that we have a real concrete goal the organization can put an action plan in place to achieve those goals.

Communication can be a real challenge when teams have different reporting structures and are in different physical locations.  Even if folks are in the same building it’s really important for face to face, human interaction. It’s certainly easier to send an email or text but nothing beats in-person interaction with a regular cadence. Collaboration tools will certainly come into play as well – likely what you already have in place but there are new DevOps communications tools coming to market as well.  But first start with team meetings and breaking down barriers.

3. Practice makes perfect: continuous integration, testing and monitoring

DevOps is about short-circuiting traditional feedback control mechanisms to speed up all aspects of an application roll-out.  This means exactly the opposite of what we typically see in many large software programs and has been particularly acute within large government programs, or at least more visible.

Striving for perfection is certainly a worthy goal, but we should really be striving for better.  This means along the way risks will need to be taken, failures will happen and course corrections put in place.  It is important to realize that this whole DevOps change will be uncomfortable at first, but taking the initial steps and perfecting those steps will help build momentum behind the initiative.

Instead of trying to do every possible piece of DevOps all at once, start with one component such as GIT and learn how to really manage versioning well.Then start working with cookbooks and even use Chef to deploy Jenkins, cool eh?

It’s probably also worth noting that training and even hiring new talent could be a key driving factor in how quickly you implement this methodology.

4. Having the right tools helps

Like I said earlier, everyone loves new tools.. I love new tools!  Since this whole DevOps movement is quite new you should realize that the marketplace is evolving rapidly. What is hot and useful today could not be what you thought you needed tomorrow.

If you already have strong relationships with certain vendors and VAR partners this would be a great time to leverage their expertise in this area (assuming they have it) to look at where gaps exist and where the quick wins are.  If platform automation and consistency of configuration is the right place for the organization to start then going with Chef or Puppet could make sense.

I think the important factors here are:

      • What are your requirements?
      • What do you have budget do acquire and manage?
      • Do you have partners who can help you with requirements and matching up different vendors or service offerings?

Since this could easily turn into a whole series of blog posts on DevOps tools, I’m not going to go through all the different products out there. But if you can quickly answer the questions above, then get moving and don’t allow the DevOps journey to stall at this phase.

If it’s difficult to figure out exactly what requirements are important or you don’t have good partners to work with, then go partner with some of the best out there or copy what they are doing.

5. Security at the pace of DevOps

What about security? Building in security as part of the development process is critical to ensuring fatal flaws do not permeate a development program. Unfortunately, often times this is an afterthought.

Security hasn’t kept pace with software development by any metric so taking a fresh look at techniques and tools has to be done.

Static analysis tools and scanners aren’t terribly effective anymore (if they were to begin with). According to Contrast Security’s CTO and Founder, Jeff Williams, we should be driving towards continuous application security (aka. Rugged DevOps):

“Traditional application security works like waterfall software development – you perform a full security review at each stage before proceeding. That’s just incompatible with modern software development. Continuous application security (also known as Rugged DevOps) is an emerging practice that revolves around using automation and creating tests that verify security in real time as software is built, integrated, and operated. Not only does this eliminate traditional appsec bottlenecks, but it also enables projects to innovate more easily with confidence that they didn’t introduce a devastating vulnerability.”  – Jeff Williams

While DevOps is all about streamlining IT and bringing new applications to market faster, if you don’t ensure that the application can perform under a realistic load in a way real world users interact, there will be problems.

Likewise if an application is rolled out with security flaws that are overlooked or ignored, it could be game over for not only the business but quite possibly the CEO as well. Just look to Target as a very recent example.

It is clear that an integrated approach to developing applications is valuable to organizations, but if you don’t look at the whole picture – operational issues, performance under load and security, you could find out that DevOps was a fast track to disaster. And obviously no one wants that.


—————

Peter CannellThis post was written by Peter Cannell. Peter has been a sales and engineering professional in the IT industry for over 15 years. His experience spans multiple disciplines including Networking, Security, Virtualization and Applications. He enjoys writing about technology and offering a practical perspective to new technologies and how they can be deployed. Follow Peter on his blog or connect with him on Linkedin.

Scenario Testing: Four Tips on How to Manage Effectively

This article was originally written for Software Testing Professionals.

————

Testing software has always been complex. The minute you add more than a handful of features to any system, theoretical complexity sky rockets.

All the buttons to click, links to follow, client browser versions, client bandwidth and what have you, will soon add up to a near infinite number of things you’d need to test. At the same time, actual users will only engage with a small fraction of those features.

But how does one bring some order to this complexity when, barring a few exceptions, 100% test coverage is basically impossible to achieve?

One approach is to turn to scenario testing. This is where you use a real or hypothetical story that describes how a user actually uses the application. It may sounds very similar to a test case, but a test case is typically single step, whereas scenario tests cover a number of interconnected steps.

A good scenario is one that is based on a credible story of a user performing a complex task. The scenario should be:

  • Critical to all stakeholders (i.e sales, marketing, management, customer support)
  • It should be obvious that the scenario must work as expected
  • The scenario must be easy to evaluate

Scenario testing is primarily thought of as a tool to facilitate feature testing, but performance is sometimes part of that.

Since application performance is very often a non-functional requirement, satisfactory performance is often assumed and lack there of is considered a bug – even if it was never mentioned in the requirements.

Therefore, scenario testing can be used to uncover important performance bottlenecks as well as test features.

Consider this test case for an e-commerce site.

Test case #1: Add valid coupon worth X%
Steps:

  1. Add one or more products to the cart
  2. Go to the checkout page
  3. Add coupon code ‘TEST123’ and click ‘Add coupon’

Expected result:

  • Page refreshes. Message “coupon successfully applied” is visible
  • Discount clearly indicated in the cart summary section
  • Cart total is reduced by X%

Now, imagine that the test case is performed and confirmed to work during development. One of the testers makes a note saying that sometimes, the page refresh takes 4-5 seconds when you have more than 10 products in the cart, but it’s not considered a major issue since it’s affecting a very small number of users.

Now, consider an actual user, Lisa, as she uses the e-commerce site:

Lisa gets a 15% coupon code for an eCommerce site she’s used before and really likes. She decides to order a few things she needs and also asks her mother and sister if they need anything. While she’s shopping, she talks once with her mother and three times with her sister to double check she get’s correct amount, sizes and colors of all items.

After about 20 minutes, Lisa has 20 items worth $900 in her cart. She hits the checkout page where she enters the discount code. The page seems to be doing ‘something’ but after 5 seconds with no visual feedback, Lisa decides that it’s most likely expected behaviour and hits ‘Pay now‘ to proceed. She’s a little worried that she can’t see her discount on the screen, but assumes that it will be presented on the emailed receipt.

Five minutes after completed checkout, she receives the receipt and realizes that she didn’t get the discount. At this point, Lisa feels let down and decides to try to cancel the order. Maybe she will try again later, maybe not.

The story of Lisa’s real world shopping experience makes a great base for a test scenario. A credible story of a user performing a complex task. It highlights to relevant stakeholders – like sales, marketing, management, customer support – that it’s important functionality that really needs to work.

It is, of course, possible to write a few test cases that would capture the same performance issue, but by putting the steps into a realistic and credible context, the coupon code response time suddenly stands out as an important issue.

It suddenly becomes easier to spot and it becomes apparent that, even if it’s a small fraction of all http requests to the server, it will likely seriously affect a customer that wishes to make a rather large transaction. Which, I would like to point out, was the main reason the marketing/sales team wanted to distribute the coupon code in the first place.

Finally, since scenarios are much easier to understand for people outside R&D, it’s easier to involve everyone with an interest in the project. In most organizations, stakeholders such as sales and marketing, customer support and management will find scenarios much easier to grasp than a long (and sometimes boring) list of small test cases.

The challenge is, of course, to find correct and credible stories that both motivate the important stakeholders to participate and at the same time covers as much of the application as possible.

Performance testing can benefit from a scenario approach in many ways. One of the most obvious benefits is that creating scenarios helps to highlight the important application flows that must perform well – just as the coupon code scenario above shows.

Test configurations can then be more focused when we know what the most important areas are. And since scenarios are stories that are easier to understand, it’s also easier for non-technical people to be part of the prioritization work, making sure that first things come first.

Another great benefit that can come specifically from performance testing multiple complex scenarios at the same time is that it can unveil dependencies.

Let’s say that one problem area with an e-commerce web application is slow internal search. While that’s a problem on it’s own, it’s not unlikely that if affects overall database performance. That in turn can affect more important functionality that also uses the database – like registration or checkout.

When applying the concept of scenario testing to your performance testing efforts, here’s a few things keep in mind:

  1. Consider using scenarios in your performance testing. Use tools such as Google Analytics to analyze what paths users take through your site to help you come up with credible and critical scenarios.
  2. Prioritize possible scenarios by thinking how valuable each scenario is. A user browsing your products is good, a user that checks out and pays is better. Make sure you cover the most critical scenarios first by ordering them according to how valuable they are to you.
  3. Consider using Continuous Integration tools such as Jenkins or TeamCity to automate performance scenario testing. An automated test that gives you pass/fail results based on response time is very easy to evaluate.
  4. When the number of scenarios grow, group different ones together based on what part of the system they test. Or group them based on complexity, making sure that all low complexity tests pass before you run the high complexity ones.

———

23582b6This post was written by Robin Gustafsson. Robin is currently CTO at Load Impact. Prior to his role as CTO, he held positions as Solutions Architect, Consultant and lead developer for numerous other tech startups and tech firms, including Ericsson. He also owned and operated his own web development company, Popmint Media, from 2002-2005. Robin specializes is performance testing, software architecture, cloud and distributed computing, as well as Continuous Delivery software development.

Test Driven Development and CI using JavaScript [Part II]

This is the second half of a two part article on Test Driven Development and Continuous Integration (CI) using JavaScript. Part I covers different types of testing and approaches to Test Driven Development (TDD).

Behavior-Driven Development (BDD) is a specialized version of Test Driven Development (TDD) focused on behavioral specifications. Since TDD does not specify how the test cases should be done and what needs to be tested, BDD was created in response to these issues.

It’s easy to talk about Behavioral Driven Development (BDD), but it’s more difficult to actually put it into practice. BDD is a fairly new concept, so it’s not completely intuitive for some coders who have been working with Continuous Integration (CI) for a long time.

This article gives a real-world example application using the concept of a “Shapes” object. The “Shapes” object contains classes for each shape and the application is a small JavaScript application that uses BDD for testing.

BDD and Software Testing

This tutorial covers how to use BDD to test your JavaScript code. In the following example, some test cases are written along with the corresponding code. The code is then refactored to fix bug issues.

Project: Create an application that contains a set of shapes. For every shape, calculate its area.

Application structure

You can create different kinds of folder structures for your applications. For example, you can divide your code into public and private folders to correspond to your class types.

Create a structure for your project using the following:

+ public 
   + javascripts 
       + app               
       + lib 
           - require.js 
+ private 
   + javascripts 
       + lib 
           + jasmine-2.0.0 
.	... 
       + spec 
- SpecRunner.html 

Save your Jasmine libraries in the private folder. In the public folder, store RequireJS to use in your models.

Creating a test

Using TDD as methodology, you start creating small test cases. Test cases require good design, but you also need to consider your code. You can also rewrite some of your test cases as you improve your code.

Start creating tests for your application. For example, the following is a list of considerations you could make about your application:

  • Do you want to organize my shapes into classes? Since a shape could represent one object, it’s a good idea to design a class for each shape.

  • You will probably need a method to calculate the area of your shapes. 

The following is a test case that fits the above two code requirements:

describe("Shapes", function () {
    describe("Square", function () {
        var that = this;

        beforeEach(function (done) {
            require(['Shape/Square'], function (Square) {
                that.shape = new Square();
                done();
            });
        });

        it("with side 0 should have an area of 0", function () {
            expect(that.shape.getArea(0)).toBe(0);
        });

        it("with side 2 should have an area of 4", function () {
            expect(that.shape.getArea(2)).toBe(4);
        });

        it("with side 4 should have an area of 16", function () {
            expect(that.shape.getArea(4)).toBe(16);
        });

        it("with side 123.123 should have an area of 15159.27", function () {
            expect(that.shape.getArea(123.123)).toBe(Math.pow(123.123, 2));
        });
    });
});

/private/javascripts/spec/Shape/SquareSpec.js

The above test case fits the division specifications.

  • Suites: The method describe is used with the story’s name. In this case, you want to describe the actions to apply to Shapes and Square. The second argument is a function, which will contain Spec or more Suites. 
  • Spects: The keyword it is used with a “with XXX should” sentence. The way the sentence is written varies with the test case, but you should always write it as if you are writing a user story.  The second argument is a function where you start using your code for testing.
  • Expect: This statement helps you test code with simple sentences for output.  These statements usually do comparisons between values. They start with expect and find different kinds of “Matches,” which are comparison functions. An example of a “Match” is the function toBe .

This code gives you tips for organizing the code later.  The story for the first test looks like this:

  • Given a Shape which is a Square
  • And with side 0
  • Then the shape should have an area of 0

In order to create this story and obtain the right result, you create expectations: 

  • expect the area of 0 toBe 0

As you can see, it is very easy to read the tests, which allows you to create stories.

Creating the model

Now that we did a small test, we may have some idea about how to organize our code. We will create a base class called Shape.js and a class that represents the shape Square.

define("Shape/Shape", [], function() {
    function Shape() {
    }

    Shape.prototype.getArea = function() {
        return 0;
    };

    return Shape;
});
/public/javascripts/app/Shape/Shape.js
define("Shape/Square", ["Shape/Shape"], function (Shape) {
    function Square() {
        Shape.call(this);
    }
    Square.prototype = new Shape();
    Square.prototype.constructor = Square;

    Square.prototype.getArea = function (side) {
        return side * side;
    };

    return Square;
});

/public/javascripts/app/Shape/Square.js

As you can see, our shape contains a method to calculate the area. In the case of the Square, we need to pass it an argument for the side.

Running tests

A SpecRunner file is a file that runs all your test cases. You can organize them into suites and sets of SpecRunners. For this example, you create one file that runs all test cases.

Open the file SpecRunner.html and modify it with the following content:

<!DOCTYPE HTML>

<html>

<head>
  <metahttp-equiv="Content-Type"content="text/html; charset=UTF-8">
  <title>Jasmine Spec Runner v2.0.0</title>

  <link rel="shortcut icon"type="image/png"
href="private/javascripts/lib/jasmine-2.0.0/jasmine_favicon.png">
  <link rel="stylesheet"type="text/css"
href="private/javascripts/lib/jasmine-2.0.0/jasmine.css">

  <script type="text/javascript"
src="public/javascripts/lib/require.js"></script>
  <script type="text/javascript">
  requirejs.config({
  baseUrl: 'public/javascripts/app',
  paths: {
     jasmine: 'private/javascripts/lib/jasmine-2.0.0/jasmine'
  },
  shim: {
     jasmine: {
        exports: 'jasmine'
     }
  }
});
</script>

    <script type="text/javascript" 
src="private/javascripts/lib/jasmine-2.0.0/jasmine.js"></script>
    <script type="text/javascript" 
src="private/javascripts/lib/jasmine-2.0.0/jasmine-html.js"></script>
    <script type="text/javascript" 
src="private/javascripts/lib/jasmine-2.0.0/boot.js"></script>

    <!-- include source files here... -->
    <script type="text/javascript" 
src="public/javascripts/app/Shape/Square.js"></script>

    <!-- include spec files here... -->
    <script type="text/javascript" 
src="private/javascripts/spec/Shape/SquareSpec.js"></script>

</head>

<body>
</body>

</html>

/SpecRunner.html

The content is divided in three main sections:

  • Load and configure libraries for requireJS (public/javascripts/lib/require.js).
  • Load the necessary libraries for Jasmine (private/javascripts/lib/jasmine/…).
  • Load the application source files (public/javascripts/app/Shape/Square.js).
  • Load the test source files (private/javascripts/spec/Shape/SquareSpec.js)

If you execute (open) the file with your favorite browser, you see the following result:

Green Lines copy

All green labels show us that all tests have been passed correctly.

Refactoring code

In most cases, you’ll need to do a least a little refactoring after running your test cases. The following is an example of some real-world questions you could have about the test case results:

  • You could set the size of “side” using the method setSide instead of passing it though getArea method.

Do the following changes to the test cases, which create a new method setSide

describe("Shapes", function () {
   describe("Square", function () {
      var that = this;

      beforeEach(function (done) { 
            require(['Shape/Square'], function (Square) { 
              that.shape = new Square(); 
              done(); 
            }); 
      });

      it("with side 0 should have an area of 0", function () { 
         that.shape.setSide(0); 
         expect(that.shape.getArea()).toBe(0); 
      });

      it("with side 2 should have an area of 4", function () { 
         that.shape.setSide(2); 
         expect(that.shape.getArea()).toBe(4); 
      });

      it("with side 4 should have an area of 16", function () { 
         that.shape.setSide(4); 
         expect(that.shape.getArea()).toBe(16);
      });

      it("with side 123.123 should have an area of 15159.27", function () { 
         that.shape.setSide(123.123); 
         expect(that.shape.getArea()).toBe(Math.pow(123.123, 2)); 
    }); 
  }); 
});

/private/javascripts/spec/Shape/SquareSpec.js

After you make the changes to the test cases, refresh your browser. In this example, the test cases fail.

fail copy

Since the test cases failed, you know you’ve broken your application. The failed test cases are the advantage of BDD since these test cases let you know that there are errors in your application – before you write too much code . Because you’ve only written a small amount of code, you only have a small amount of code to refactor from the failed test cases. If you had written the entire application, you would have hours of refactoring ahead of you. Even if you have one class used in several modules, every module has its own test.

Now we can fix the model:

define("Shape/Square", ["Shape/Shape"], function (Shape) {    
    function Square() {
        Shape.call(this);

        this.side = 0;
    }
    Square.prototype = new Shape();
    Square.prototype.constructor = Square;

    Square.prototype.setSide = function (value) {
        this.side = value;
    };

    Square.prototype.getArea = function () {
        return this.side * this.side;
    };

    return Square;
});

/public/javascripts/app/Shape/Square.js

After you refactor your code, the tests will now run successfully.

In this tutorial, a basic use for TDD in JavaScript was used. However, you can use TDD in any language that supports test cases.

————


avatarThis post was written by Miguel Dominguez. Miguel is currently Senior Software Developer at digitallabs AB but also works as a freelance developer. His focus is on mobile application (android) development, web front-end development (JavaScript, CSS, HTML5) and back-end (mvc, .net, java). Follow Miguel’s blog.

Test Driven Development and CI using JavaScript [Part I]

In this tutorial, we will learn how to apply TDD (Test-Driven Development) using JavaScript code. This is the first part of a set of tutorials that includes TDD and CI (Continuous Integration) using JavaScript as the main language.

Some types of testing

There are several approaches for testing code and each come with their own set of challenges. Emily Bache, author of The Coding Dojo Handbook, writes about them in more detail on her blog – “Coding is like cooking

1. Test Last: in this approach, you code a solution and subsequently create the test cases.

  • Problem 1: It’s difficult to create test cases after the code is completed.
  • Problem 2: If test cases find an issue, it’s difficult to refactor the completed code.

2. Test First: you design test cases and then write the code.

  • Problem 1: You need a good design and formulating test cases increases the design stage, which takes too much time.
  • Problem 2: Design issues are caught too late in the coding process, which makes refactoring the code more difficult due to specification changes in the design. This issue also leads to scope creep.

TDD-diagram-1

3. Test-Driven: You write test cases parallel to new coding modules. In other words, you add a task for unit tests as your developers are assigned different coding tasks during the project development stage.

TDD-diagram-2


TDD approach

TDD focuses on writing code at the same time as you write the tests. You write small modules of code, and then write your tests shortly after.

Patterns to apply to the code:

  • Avoid direct calls over the network or to the database. Use interfaces or abstract classes instead.
  • Implement a real class that implements the network or database call and a class which simulates the calls and returns quick values (Fakes and Mocks).
  • Create a constructor that uses Fakes or Mocks as a parameter in its interface or abstract class.

Patterns to apply to unit tests: 

  • Use the setup function to initialize the testing, which initializes common behavior for the rest of the unit test cases.
  • Use the TearDown function to release resources after a unit test case has finalized.
  • Use “assert()” to verify the correct behavior and results of the code during the unit test cases.
  • Avoid dependency between unit test cases.
  • Test small pieces of code.


Behavior-Driven Development

Behavior-Driven Development (BDD) is a specialized version of TDD focused on behavioral specifications. Since TDD does not specify how the test cases should be done and what needs to be tested, BDD was created in response to these issues.

Test cases are written based on user stories or scenarios. Stories are established during the design phase. Business analysts, managers and project/product managers gather the design specifications, and then users explain the logical functionality for each control. Specifications also include a design flow so test cases can validate proper flow.

This is an example of the language used to create a BDD test story:

Story: Returns go to stock

In order to keep track of stock

As a store owner

I want to add items back to stock when they’re returned


Scenario 1Refunded items should be returned to stock

Given a customer previously bought a black sweater from me

And I currently have three black sweaters left in stock

When he returns the sweater for a refund

Then I should have four black sweaters in stock


Scenario 2:  Replaced items should be returned to stock

Given that a customer buys a blue garment

And I have two blue garments in stock

And three black garments in stock.

When he returns the garment for a replacement in black,

Then I should have three blue garments in stock

And two black garments in stock


Frameworks to Install

1. Jamine

Jasmine  is a set of standalone libraries that allow you to test JavaScript based on BDD. These libraries do not require DOM, which make them perfect to test on the client side and the server side. You can download it from http://github.com/pivotal/jasmine

It is divided into suites, specs and expectations

.Suites define the unit’s story. 

.Specs define the scenarios. 

.Expectations define desired behaviors and results. 

Jasmine has a set of helper libraries that lets you organize tests.  

2. RequreJS

RequireJS is a Javascript library that allows you to organize code into modules, which load dynamically on demand.

By dividing code into modules, you can speed up the load-time for application components and have better organization of your code.

You can download RequireJS from http://www.requirejs.org

Part II of this two part tutorial will discuss Behavioral Driven Testing and Software Testing – how to use BDD to test your JavaScipt code. Don’t miss out, subscribe to our blog below. 

————-

avatar

This post was written by Miguel Dominguez. Miguel is currently Senior Software Developer at digitallabs AB but also works as a freelance developer. His focus is on mobile application (android) development, web front-end development (javascript, css, html5) and back-end (mvc, .net, java). Follow Miguel’s blog.

Uncover Hidden Performance Issues Through Continuous Testing

On-premise test tools, APMs, CEMs and server/network based monitoring solutions may not be giving you a holistic picture of your system’s performance; cloud-based continuous testing can.  

When it comes to application performance a wide array of potential causes of performance issues and end user dissatisfaction exist.  It is helpful to view the entire environment, from end user browser or mobile device all the way through to the web and application servers, as the complex system that it is.

system

Everything between the user’s browser or mobile and your code can affect performance

The state of the art in application performance monitoring has evolved to include on-premise test tools, Application Performance Management (APM) solutions, customer experience monitoring (CEM) solutions, server and network based monitoring. All of these technologies seek to determine root causes of performance problems, real or perceived by end users. Each of these technologies has it’s own merits and costs and seek to tackle the problem from different angles. Often a multifaceted approach is required when high value, mission critical applications are being developed and deployed.

On-premise solutions can blast the environment with 10+Gbit/sec of traffic in order to stress routers, switches and servers. These solutions can be quite complex and costly, and are typically used to validate new technology before it can be deployed in the enterprise.

APM solutions can be very effective in determining if network issues are causing performance problems or if the root cause is elsewhere. They will typically take packet data from a switch SPAN port or TAP (test access point), or possibly a tap-aggregation solution. APM solutions are typically “always-on” and can be an early warning system detecting applications problems before the help desk knows about an issue.  These systems can also be very complex and will require training &amp; professional services to get the maximum value.

What all of these solutions lack is a holistic view of the system which has to take into account edge devices (Firewalls, Anti-Malware, IPS, etc), network connectivity and even endpoint challenges such as packet loss and latency of mobile connections. Cloud-based testing platforms such as Load Impact allow both developers and application owners to implement a continuous testing methodology that can shed light on issues that can impact application performance that might be missed by other solutions.

A simply way to accomplish this is to perform a long-term (1 to 24+ hr) application response test to look for anomalies that can crop up at certain times of day.  In this example I compressed the timescale and introduced my own anomalies to illustrate the effects of common infrastructure changes.

The test environment is built on an esxi platform and includes a 10gbit virtual network, 1gbit physical LAN, Untangle NG Firewall and a 50/5 mbit/sec internet link.  For the purposes of this test the production configuration of the Untangle NG Firewall was left intact – including Firewall rules, IPS protections however QoS was disabled.  Turnkey Linux was used for the Ubuntu-based Apache webserver with 8 CPU cores and 2 gigs of ram.

It was surprising to me what did impact response times and what had no effect whatsoever.  Here are a few examples:

First up is the impact of bandwidth consumption on the link serving the webserver farm.  This was accomplished by saturating the download link with traffic, and as expected it had a dramatic impact on application response time:

Impact of download activity on application response times

At approx 14:13 link saturation occurred (50Mbit) and application response times nearly tripled as a result

bandwidth

Snapshot of the Untangle Firewall throughput during link saturation testing

Next up is executing a Vmware snapshot of the webserver.  I fully expected this to impact response times significantly, but the impact is brief.  If this was a larger VM then the impact could have been longer in duration:

impact-of-snapshot-on-apache-VM

This almost 4x spike in response time only lasts a few seconds and is the result of a VM snapshot

Lastly was a test to simulate network congestion on the LAN segment where the webserver is running.  

This test was accomplished using Iperf to generate 6+ Gbit/sec of network traffic to the webserver VM.  While I fully expected this to impact server response times, the fact that it did not is a testament to how good the 10gig vmxnet3 network driver is:

iperf

Using Iperf to generate a link-saturating 15+Gbit/sec of traffic to Apache (Ubuntu on VM)


simulate network congestion using iperf 2

In this test approx 5.5Gbit/sec was generated to the webserver,no impact whatsoever in response times

Taking a continuous monitoring approach for application performance has benefits to not only application developers and owners, but those responsible for network, security and server infrastructure.  The ability to pinpoint the moment when performance degrades and correlate that with server resources (using the Load Impact Server Metrics Agent) and other external events is very powerful.  

Often times application owners do not have control or visibility into the entire infrastructure and having concrete “when and where” evidence makes having conversations with other teams in the organization more productive.

———-

Peter CannellThis post was written by Peter Cannell. Peter has been a sales and engineering professional in the IT industry for over 15 years. His experience spans multiple disciplines including Networking, Security, Virtualization and Applications. He enjoys writing about technology and offering a practical perspective to new technologies and how they can be deployed. Follow Peter on his blog or connect with him on Linkedin.

Load Impact: Closed Vulnerability to Heartbleed Bug

As you may have heard, a serious bug in the OpenSSL library was recently found. The bug, known colloquially as “Heartbleed” (CVE-2014-0160), impacted an estimated two-thirds of sites on the internet – including Load Impact.

While Load Impact has no evidence of anyone exploiting this vulnerability, we have taken action to mitigate all risks and are no longer vulnerable. 

The vulnerability has existed in OpenSSL the past two years and, during this time, could have been used by malicious hackers to target a specific online service or site, and covertly read random traffic between the site and its users. Over time, this means an attacker could gather sensitive information such as account details, passwords, encryption keys, etc. used by the site or its users.

Many sites have unknowingly been vulnerable to this bug the past two years, and most probably have little or no information about whether they have been targeted by hackers or not, as the attack would appear to be an entirely legitimate request and is unlikely to even be logged by most systems.

We advise you to be aware of this issue and ask your various online service providers for information if they haven’t provided you an update already. You should also consider changing your passwords on most systems you have been using for the past two years.

Load Impact has only been vulnerable to this bug since October 2013 – when we started using Amazon’s SSL service (through Amazon’s ELBs) – so our exposure is limited. However, since there is still a risk that someone may have stolen information from us in the past six months, we have now replaced our SSL certificates and keys. 

As an extra precaution, we advise our users to:

  • Create a new password
  • Generate new API keys

Feel free to contact us if you have any questions.

More info on the OpenSSL “Heartbleed bug” can be found here: http://heartbleed.com/

WordPress Vertical Scalability Part I: How Performance Varies with Changes in Hardware

How does your web application respond to improvements in the underlying hardware? Well, that will depend a lot on your application. Different applications are limited by different factors such as RAM, CPU, bandwidth, disk speed to name a few. In this article, I’ll show you an approach to finding out how to test your way to understanding how your application consumes resources.

At some point in the development cycle, preferably early, it makes good sense to narrow down what factors limit your application the most. It’s also useful to flip that statement around and ask yourself: what hardware improvements will benefit your overall performance the most? If you focus on the latter of the two statements, the solution is probably the most important information you need for good resource planning.

To demonstrate the concept of vertical scalability testing, (or hardware sensitivity testing), I’ve set up a very simple WordPress 3.8.1 installation and will examine how performance varies with changes in hardware. The tests are made using virtual machines where hardware changes are easy to make. I’ve created a simple but somewhat credible user scenario using the Load Impact User Scenario Recorder for Chrome.

The simulated users will:

  •  Surf to the test site
  •  Use the search box to search for an article
  •  Surf to the first hit in the search results
  •  Go back to the home page

The baseline configuration is very conservative:

  • CPU: 1 core
  • RAM: 128 Gb
  • Standard disks.

The test itself is a basic ramp up test going from 0 to 50 concurrent users. Based on experience from previous tests with WordPress, a low power server like this should not be able to handle 50 concurrent users running stock WordPress. The idea is to run the test until we start seeing failures. The longer it takes before we see failures, the better. In the graph below, the green line is number of simulated users, the blue line is average response time and the red line is the failure rate measured as number of failed requests/s. As you can see, the first failed requests are reported at 20 concurrent users.

baseline

A comment on the response times (blue line) going down. At a high enough load, nearly 100% of all responses are error messages. Typically, the error happens early in the request and no real work is carried out on the server. So don’t be fooled by falling response times as we add load, it just means that the server is quick to generate an error.


RAM Memory sensitivity

First, I’m interested to see how performance varies with available RAM. I’ve made the point in previous articles that many PHP based web applications are surprisingly hungry for RAM. So let’s see how our baseline changes with increased RAM:

At 256 Mb RAM (2x baseline):

RAM256

At 512  Mb RAM (4x baseline)

RAM512


That’s a quite nice correlation. We see that the number of simulated users that can be handled without a failure is moved higher and higher. At 1024 Mb RAM (8x baseline) we actually don’t get any error at all:

RAM1024

Also note that before the WordPress server spits out errors, there’s a clear indication on the response times. At a light load, any configuration can manage about 1s response time, but as the load increases and we’re nearing the point where we see errors, response times have already gone up.


Sensitivity to CPU cores

Next angle is to look at CPU core sensitivity. With more CPU available, things should move faster, right? RAM memory has been reset to 128 Mb, but now I’m adding CPU cores:

Using 2 CPU cores (2x baseline)

2xCPU

Ops! As you can see, this is fairly close to the baseline. First errors start happening at 20 concurrent users, so more CPU couldn’t do anything to help the situation once we run out of memory. For the sake of completeness, looking at using 4 CPU cores shows a tiny improvement, first errors appear at 23 concurrent users instead of 20.

Using 4 CPU cores (4x baseline)

4xCPU

Adding more CPU cores doesn’t seem to be my highest priority.


Next step, mixing and matching.

You’ve probably already figured out that 128 Mb RAM is too little memory to host a stock WordPress application. We’ve discussed WordPress specifically before and this is not the first time we realize that WordPress is hungry for RAM. But the point of this article wasn’t about that. Rather, I wanted to demonstrate a structured approach to resource planning.

In a more realistic scenario, you’d be looking for a balance between RAM, CPU and other resources. Rather than relying on various ‘rules of thumb’ of varying quality, performing the actual measurements is a practical way forward. Using a modern VPS host that let’s you mix and match resources, it’s quite easy to perform these tests. So the next step is your’s.

My next step will be to throw faster disks (SSD) into the mix. Both Apache/PHP and MySQL benefits greatly from running on SSD disks, so I’m looking forward to seeing those numbers.

Comments, questions or criticism? Let us know by posting a comment below:

——-

0b59bcbThis article was written by Erik Torsner. Erik is based in Stockholm, Sweden, and shares his time between being a technical writer and customer projects manager within system development in his own company. Erik co-founded mobile startup EHAND in the early 2000-nds and later moved on to work as technology advisor and partner at the investment company that seeded Load Impact. Since 2010, Erik manages Torgesta Technology. Read more about Erik on his blog at http://erik.torgesta.com or on Twitter @eriktorsner.


[NEW RELEASE] Mobile Performance Testing – Including Network and Client Emulation

Mobile-FeatureToday, we introduced the first true cloud-based load testing Software as a Service for mobile apps, APIs and websites that can simulate traffic generated from a variety of mobile operating systems, popular browsers, and mobile networks – including 3G, GSM and LTE.

Current, only about half of companies with mobile sites or apps today test their mobile code, and a recent industry study reported that when a mobile app fails, 48 percent of users are less likely to use the app again, 34 percent will switch to a competitor, and 31 percent will tell others about their poor experience. [1]

Our new testing service for mobile apps, APIs and websites allows developers to emulate client behavior when downloading content to a phone, specify the number of concurrent downloads in total and per host, as well as the mix of different client applications or browsers, including Safari, Chrome, Firefox and Opera.

Developers can also use our new features to emulate mobile network characteristics including available bandwidth, network delay, packet loss, jitter and packet reordering.

So what’s REALLY changed?

What’s really new is that when we simulate a mobile client – whether it is a mobile user running a mobile web browser and accessing a standard web site, or it is a mobile user playing the Candy Crush app – we can generate the same kind of traffic for the servers to handle that real users would.

If the average mobile user has a network connection speed of, say, 384 kbit/s (old generation 3G) we will not let our simulated client load data faster than that from the servers.

li-test-config-network-emulation

In previous versions of  Load Impact, and in most other load testing tools, every simulated client/user in a load test will load things at maximum possible speed, at all times. This will of course result in a very skewed test result, that might tell you your site/app can handle max 1,000 concurrent users while in reality you could handle a lot more (or less).

Apart from simulating network connection speed, we also simulate network latency, which is equally important for performance as connection speed is  –  just like connection speed, latency also affects how “heavy” a client is for the servers to handle.

Mobile-testing-infographic4

Our network/client emulation feature is currently available at the test level only, but you will soon be able to simulate mobile traffic at the user scenario level too. We’ll be sure to let you know when the update arrives.

Mobile Network Emulation – The Key to Realistic Mobile Performance Testing

Mobile-Testing-Infographic

When was the last time you looked at your website’s browser statistics? If you have, you’ve likely noticed a trend that’s pretty hard to ignore – your users are browsing from a mobile device more than ever before. What was once a small sub-segment of your audience is now growing and representing the majority of your traffic. This may not be so surprising since today mobile usage makes up about 15 percent of all Internet traffic. Basically, if you don’t already have a mobile development strategy, you may already be loosing sales/users due to poor mobile performance. 

Responsive design takes care of your website’s layout and interface, but performance testing for mobile devices makes sure your app can handle hundreds (even thousands) of concurrent users. A small delay in load-time might seem like a minor issue, but slow mobile apps kill sales and user retention. Users expect your apps to perform at the same speed as a desktop app. It seems like a ridiculous expectation, but here are some statistics:

  • If your mobile app fails, 48% of users are less likely to ever use the app again. 34% of users will just switch to a competitor’s app, and 31% of users will tell friends about their poor experience, which eliminates those friends as potential customers. [1]
  • Mobile app development is expected to outpace PC projects by 400% in the next several years. [2]
  • By 2017, over 20,000 petabytes (that’s over 20 million gigabytes!) will be sent using mobile devices. Streaming is the expected primary driver for growth.[3]
  • 60% of mobile failures are due to performance issues and not functional errors. [4]
  • 70% of the performance of a mobile app is dependent on the network. [5]
  • A change in latency from 2ms (broadband) to 400ms (3G network) can cause a page load to go from 1 second to 30 seconds. [6]

These statistics indicate that jumping into the mobile market is not an option but a necessity for any business that plans to thrive in the digital age. You need more than just a fancy site, though. You need a fast fancy site. And the surefire way to guarantee your mobile site/app can scale and deliver a great performance regardless of the level of stress on the system is to load test early and continuously throughout the development process. 

Most developers use some kind of performance testing tools during the development process. However, mobile users are different than broadband users and therefore require a different set of testing tools to make sure they are represented realistically in the test environment. Mobile connections are less reliable; each geographic area has different speeds; latency is higher for mobile clients; and older phones won’t load newer website code. Therefore, you need real-world mobile network emulation and traffic simulation.

Prior to the availability of good cloud performance testing tools, most people thought the solution to performance problems was “more bandwidth” or “more server hardware”. But those days are long over. If you are to stay competitive today, you need to know how to optimize your mobile code. Good performance testing and traffic simulations take more than just bandwidth into account. Network delays, packet loss, jitter, device hardware and browser behavior are also factors that affect your mobile website’s or app’s performance. To properly test your app or site, you need to simulate all of these various situations – simultaneously and from different geographic locations  (i.e. not only is traffic more mobile, its also more global).

You not only want to simulate thousands of calls to your system, you also want to simulate realistic traffic behavior. And, in reality, the same browser, device and location aren’t used when accessing your site or app. That’s why you need to simulate traffic from all over the globe with several different browsers and devices to identify real performance issues. For instance, it’s not unlikely to have a situation where an iPhone 5 on the 4G network will run your software fine, but drop down to 3G and the software fails. Only realistic network emulation covers this type of testing environment.

Finally, simulating real user scenarios is probably the most important testing requirement. Your platform’s user experience affects how many people will continue using your service and how many will pass on their positive experience to others. Real network emulation performs the same clicks and page views as real users. It will help find any hidden bugs that your testing team didn’t find earlier and will help you guarantee that the user experience delivered to the person sitting on a bus using a 3G network is the same as the individual accessing your service seated at their desktop connected through DSL.  

Several years ago, mobile traffic was negligible, but it’s now too prominent to ignore. Simple put, don’t deploy without testing your mobile code!

Check out Load Impact’s new mobile testing functionality. We can simulate traffic generated from a variety of mobile operating systems, popular browsers, and mobile networks – including 3G, GSM and LTE. Test your mobile code now!

About Load Impact

Load Impact is the leading cloud-based load testing software trusted by over 123,000 website, mobile app and API developers worldwide.

Companies like JWT, NASDAQ, The European Space Agency and ServiceNow have used Load Impact to detect, predict, and analyze performance problems.
 
Load Impact requires no download or installation, is completely free to try, and users can start a test with just one click.
 
Test your website, app or API at loadimpact.com

Enter your email address to follow this blog and receive notifications of new posts by email.