Server Metrics Tutorial

Here at Load Impact, we’re constantly developing new features to help make our load testing tool even more powerful and easy to use. Our latest feature, Server Metrics, now makes it possible for you to measure performance metrics from your own servers and integrate these metrics with the graphs generated from your Load Impact test. This makes it much easier for you to correlate data from your servers with test result data, while helping you identify the reasons behind possible performance problems in your site. We do this by installing agents on your servers in order to grab server metrics data, which we can later insert into the results graph.

Having been a pure online SaaS testing tool, we don’t like the hassle that downloads and setups bring, so we’ve tried to make it really simple to set this up and use. (After all, we are trying to make testing more efficient, not more frustrating!)

Here’s 5 steps on how you can get Server Metrics up to a flying start:

Step 1 (Optional): Check out where Server Metrics appears in your Test Configuration

Go ahead and Log In to your account, then select the Test Configuration tab and create a new configuration. Alternatively, if you have current test configurations already set up, select one. Below the “User Scenarios” subsection, you should now find a section named “ Server Metrics”.  Click on “Go to Your account page”.
Alternatively, skip this step altogether and head straight to “Access Tokens” under the “Account” tab.

Step 2: Generating a Token

In order to identify our agents when they are talking to Load Impact, we need an identification key. We refer to this as a token. To generate a token, follow the instructions as stated.
(Yes, you only have to click on the “Generate a new token” button. Once :P)

Step 3: Download and install Server Metrics agent

Now comes the hardest part. You’ll need to download and install our Server Metrics agent for your server platform. Installation should be as basic as following the instructions in our Wizard, on in the README file.

Step 4: Run your test!

Once the server metrics agent is configured, you’ll immediately be able to select it in your Test Configuration (see Step 1). We recommend giving a name that describes the name of the server you’re installing it on for easier identification later on. From here, just configure and run your test as per normal.

Step 5: Viewing Server Metrics in your test results

Once your test has started, you should be able to see your Server Metrics results in real time, just as with all of our other result graphs. Simply select the the kind(s) of server metrics you wish to view in the “Add Graph” drop down menu. This will plot the results for the specific server metric that you wish to view.

And that’s it! You’re all set towards easier bottleneck identification 🙂
For an example of how these graphs are can help make your load testing life easier, take a look at the test results below. These results show your server’s CPU usage as load is being increased on your website.

Don’t think this is simple enough? Email support [at] loadimpact [dot] com to let us know how we can do one better!

Cloud Based Server-Side Load Testing

Just recently we announced the release of our Server Metrics agent. A feature that makes it possible to gather internal data from your server.

To get started with Server Metrics, please check out this tutorial that will guide you through the installation and setup process.

When Load Impact runs a test, the test server will collect a wide array of externally measured data. By measuring the load target from our end, we can quite easily pick up and store data about clients active, response time, transactions per second – just to name a few. We present this data to you in our web UI online, exported in CSV file or via our API for further analysis.

But there are a lot of other measurements that most of our users need to have to be able to do a better analysis of the performance and that is exactly what Load Impact Server Metrics tries to solve.

Fig 1. Memory and CPU usage of the target system

By installing the Server Metrics Agent on one or more target systems, our load testing server can pick up some internal measurements during the test and add those to the same data set. Load Impact  supports collecting data from several different target machines during a test, so it’s possible to get internal measurements from a fairly complex setup as well. The advantage of this is quite obvious.

Even if it would be possible to log this data separately on the target machines, you would end up with the task of trying to synchronize the time stamps of the internally generated data series with the data from Load Impact. Even if that’s of course possible to do, it’s going to be a bit of a hassle that you can easily avoid.

Technically, the Server Metric Agent software is a Python based script that will run as a service/daemon  on your target systems. It will require Python 2.6 and a fairly common library called psutil. Both Python 2.6 and psutil are open source and will run on pretty much every operating system we know of.  We offer installers for 32 and 64 bit Debian based Linux distributions, including Ubuntu, as well as for 64-bit Windows Server 2008 R2 and 2012.  For other systems, we offer the Python source code for download. Also note that in order to connect a Server Metric Agent installation to your, and only your, Load Impact account, you are required to generate a Server Metric token on your account settings page.

Different types of website performance testing – Part 3: Spike Testing

This is the third of a series of posts describing the different types of web performance testing. In the first post, we gave an overview of what load testing is about and the different types of load tests available. Our second post gave an introduction to load testing in general, and described what a basic ramp-up schedule would look like.

We now we move on to spike testing. Spike testing is another form of stress testing that helps to determine how a system performs under a rapid increase of workload. This form of load testing helps to see if a system responds well and maintains stability during bursts of concurrent user activity over varying periods of time. This should also help to verify that an application is able to recover between periods of sudden peak activity.

So when should you run a spike test?

The following are some typical example case scenarios where we see users running a spike test, and how your load schedule should be configured in Load Impact to emulate the load.

Advertising campaigns

Advertising campaigns are one of the most common reasons why people run load tests. Why? Well, take a lesson from Coca Cola – With an ad spend of US$3.5 million for a 30 second Superbowl commercial slot (not including customer cost), it probably wasn’t the best impression to leave for customers who flooded to their Facebook app.. and possibly right into Pepsi’s arms. If you’re expecting customers to flood in during the ad campaign, ramping up in 1-3 minutes is probably a good idea. Be sure to hold the load time for at least twice the amount of time it takes users to run through the entire scenario so you get accurate and stable data in the process.

Contests

Some contests require quick response times as part of the challenge issued to users. The problem with this is that you might end up with what is almost akin to a DDOS attack every few minutes. A load schedule comprising of a number of sudden spikes would help to simulate such a situation.

TV screenings/Website launches

If you’re doing a live stream of a very popular TV show (think X Factor), you might want to consider getting a load test done prior to the event. Slow streaming times or a website crash is the fastest way to drive your customers to the next streaming app/online retailer available. Take Click Frenzy as an example – they’re still working to recover their reputation. Streaming servers also tend to be subject to prolonged stress when many users all flock to watch an event or show, so we recommend doing a relatively quick ramp up and ending with a long holding time.

Ticket sales

Remember the 2012 London Olympics? Thousands of frustrated sports fans failed to get tickets to the events they wanted. Not only was it a waste of time for customers, but it also served to be a logistics nightmare for event organizers. Bearing in mind that a number of users would be ‘camping’ out on the website awaiting ticket launch, try doing a two stage quick ramp up followed by a long holding time to simulate this traffic.

TechCrunched… literally!

If you are trying to get yourself featured on TechCrunch (or any similar website that potentially might generate a lot of readership), it’s probably a good idea to load test your site to make sure it can handle the amount of traffic. It wouldn’t do to get so much publicity and then have half of them go away with a bad taste in their mouth! In these cases, traffic tends to come in slightly slower and in more even bouts over longer periods of time. A load schedule like this would probably work better:


Secondary Testing

If your test fails at any one point of time during the initial spike test, one of the things you might want to consider doing is a step test. This would help you to isolate where the breaking points are, which would in turn allow you to identify bottlenecks. This is especially useful after a spike test, which could ramp up too quickly and give you an inaccurate picture of when your test starts to fail.


That being said, not all servers are built to handle huge spikes in activity. Failing to handle a spike test does not mean that these same servers cannot handle that amount of load. Some applications are only required to handle large constant streams of load, and are not expected to face sharp spikes of user activity. It is for this reason that Load Impact automatically increases ramp-up times with user load. These are suggested ramp up timings, but you can of course adjust them to better suit your use case scenario.

Code sample for automated load testing

In the previous post about automated load testing, we didn’t have the room to include a proper sample. So that’s what this post is going to be about. The complete code sample can be found here https://github.com/loadimpact/loadimpactapi-samples

A few comments if you want to try it out:

At the beginning, we net to set token and test id. If you haven’t already done so, you can generate an API token on your accounts page https://loadimpact.com/account/. Please note that the API token is not the same as the server metrics token. The next thing is to find the test configuration id that you want to run.

test_config_buttonAssuming that you already have an account and at least one test configuration created, you just go to your test configuration list and click on the test you’re interested in running. The URL will say https://loadimpact.com/test/config/edit/NNNNN where NNNNN is your test id. At the top of the test script, you find the two variables that you need to update. $token and $test_config_id.


$token = 'aaaaaaaaaaaaaaaaaaaaaaaaaaaaaaaaaaaaaaaaaaaaa';
$test_config_id = 1234567;
$verbose = TRUE;

Then, the interesting part of the script is quite straightforward:

$resp = loadimpactapi("test-configs/$test_config_id/start", 'POST');
if(isset($resp->id)) {
 $test_id = $resp->id; // The Id of the running test.
 $running = TRUE;
 $status = loadimpactapi("tests/$test_id", 'GET');
while($running) {
 if($verbose) echo "Test $test_id is {$status->status_text} \n";
 if($status->status > 2) { 
 $running = FALSE; 
 break;
 }
 sleep(15);
 $status = loadimpactapi("tests/$test_id", 'GET');
 }
// At this point, a status code != 3 would indicate a failure
 if($status->status == 3) {
 $jsonresult = loadimpactapi("tests/$test_id/results", 'GET');
 $timestamps = resulttoarray($jsonresult);
 echo responsetimeatmaxclients($timestamps) ."\n";
 }
} else {
 echo "Test $test_config_id failed to start \n";
}

Start the test, wait for it to finish and do something with the results. It’s really only the last part, ‘do something’ that’s deserves commenting on.

The LoadImpact API will return it’s data as two time series by default (you can ask for other time series as well). Basically, each of these two are a series of observations made during the test at given time intervals. The first series is the number of active clients seen at any given time. The other series represents the average response time from the test target. The two time series are synchronized via the timestamps (UNIX epoch). The code on github includes a function that massages these two time series into a single array of timestamps. At each timestamp, we can see number of active clients as well as the response time. So in the sample, I first run resulttoarray($jsonresult); so that I get an array that is easier to work with. Then I call responsetimeatmaxclients($timestamps) to find the response time found at the highest load during the test.

At the and, the return value is simply echoed to StdOut. Running the script, I’d get something like:


erik@erik-laptop$ php test.php
Test 1234567 is Created
Test 1234567 is Initializing
Test 1234567 is Running
Test 1234567 is Finished
3747.78

Since I’ve left $verbose=TRUE, I’ll get some status messages in the output. In a real scenario where the output is likely to be handled by a script, set $verbose=FALSE so that you just get the actual measurement back to StdOut.

Questions? Ideas? Opinions? Leave a comment below, we love to hear from you.

Automating Load Testing to Improve Web Application Performance

This blog post was originally written for the Rackspace DevOps blog. Check out this post and more great dev advice on their blog.

…….

Web application performance is a moving target. During design and implementation, a lot of big and small decisions are made that affect application performance – for good and bad. You’ve heard it before. But since performance can be ruined many times throughout a project, good application performance simply can not be added as an extra feature at the end of a project.

The modern solution to mitigate quality problems throughout the application development life cycle is called Continuous Integration, or just CI. The benefits of using CI are many, but for me, the most important factor for embracing CI is the ability to run automated tests frequently and to trace application performance, since such tests need to be added to the stack of automated tests already being generated. If you have load tests carried out throughout your project development, you can proactively trace how performance is affected.

The key is being able to automate load testing. But how do we do that? Naturally, it depends on your environment. Assuming that you’re building a web application and that your build environment is already in the cloud, it would be ideal to start using a cloud based load testing service such as Load Impact to automatically generate load and measure performance. In fact, libcurl will get you almost all the way.

Load Impact’s Continuous Delivery API was created to enable developers to run load tests programmatically. It’s an http based REST API that uses JSON for passing parameters. In its most basic form, you can run the following from a command line:

$ curl -X POST https://api.loadimpact.com/v2/test-configs/X/start -u token: {"id":Y}
$ curl -X GET https://api.loadimpact.com/v2/tests/Y/results -u token: > out.json

In this example X = the LoadImpact test config id, Y = the test result id and token = your LoadImpact API token. Please note that token is sent as an http username but with a blank password.

Since JSON is not that easy to work with from the command line, using PHP or Perl to wrap the calls in a script makes sense. A more complete sample doesn’t really fit into this blog post, but at a pseudo level you want to:

<?php

$token = '123456789';
$urlbase = 'https://api.loadimpact.com/v2/';
$config_id = 999;

// Start test and get id from JSON return
$test = http_post($urlbase . "/test-configs/$config_id/start"));

$done = FALSE;
while(!$done) {
  sleep(30);
  $status = http_get($urlbase . "/tests/{$test->id}");
  $if($status->status > 2) $done = TRUE;
}

$result = http_get($urlbase . "/tests{$test-id}/results");
$last = count($results->__li_user_load_time); 
echo $results->__li_user_load_time[$last]->value; ?>

First, some variables are set, the existing test configuration id and my API token being the most interesting.

Second, I ask Load Impact to launch the test configuration and store the test id. Wait for the test to finish by asking for its status code every 30 seconds.

Lastly, when I know the test if finished, I ask for the test result that I can then query for values. In this example, I simply echo the last measurement of the actual load time. If needed, the Load Impact API also allows me to manipulate the target URL before I launched the test, change the number of simulated users or make other relevant changes.

Running repeated load test as part of your CI solution will reveal a lot about how an application’s performance is affected by all those small decisions.

Note that you probably don’t want to run a full set of exhaustive performance tests at every build. I recommend that a few well-selected tests are executed. The key is to get a series of measurements that can be tracked over time.

Bandwidth limited websites

What’s holding you back?

When you hit the limits of how much load your website can handle, you almost always want to know what it is that is holding you back. You already know that you’ve reached the limit, but what part needs to be changed in order to go higher?

The more load a web site gets, the more resources it’s going to consume. One of the many types of resources that the server needs to function will run out before the others. Sure, an extremely well balanced server setup will run out of all types of resources at the same time, but that’s probably not very common. To figure out what resource type that is causing the bottle neck, you need to look a different things. Loadimpact.com offers several interesting performance metrics that will reveal what’s holding you back. Then of course, as soon as you fix that, the next bottleneck is going to become visible, but that’s another blog post.

In this post, I’ll share some information about how you can determine that your web site performance is held back by bandwidth issues and a bit about what you can do to solve it.

How do I know it’s the bandwith?

Depending on where you host your web site, you may have access to tools and graphs from the hosting company that can give you a lot of information. But assiming that you don’t have that tool available, let’s look at how you can use Loadimpact.com to tell.

To be able to show you, I created a very simple web site that is very very bandwidth limited. The website contains one single .html file, absolutely no Python, PHP, Java, Perl or anything similar involved at all. The one file is called heavy.html and contains roughly 16Mb of the letter A. When lots of concurrent user requests heavy.html, a lot of bits will have to leave the web server all at the same time. This is the graph from the test (click to enlarge):

bandwidth

The graph reveals two interesting things. First of all, if you didn’t know already, you can add more than the two standard data series to your Loadimpact graphs. By default, Loadimpact will give you number of active clients and average response time. In this case, I’ve added the Bandwidth data series.

Second. The bandwidth graph pinpoints exactly what I was hoping for. That the bandwidth usage actually hits a plateau at roughly 70 Mbit/s. This means that somewhere between the software on my test server and the software on the measuring probe, there’s a bandwidth limitation of about 70 Mbit/s. It’s important to point out that this result doesn’t point out the exact location of that bottleneck, it just tells you it’s there. To make sure that you have a bottleneck in actually in your hosting environment, you should run the same test from different test servers. Loadimpact currently offers 8 different load zones, each load zone is in a different geographic location. Make sure you run tests from different load zones, or even more interesting, add 4-5 load zones into the same test. If you can still see your plateau at the same bandwidth usage, you can be fairly sure that you’ve found your limit.

And don’t worry if you’ve already run a series of tests using Loadimpact and didn’t add bandwidth to the graph. The data is still stored on our servers and you can add bandwidth when looking at older tests as well. So you might already have interesting data to analyze.

Ok, so what do I do about it?

If you are held back by bandwidth limitation, next step is obviously to try and do something about it. There are many potential ways you can bring down the bandwidth need.

Use compression

Make sure you use compression like gzip or deflate. By compressing the content before it’s sent from the server to the browser, you pay with some CPU resources to gain a little bandwidth. It’s safe to enable since the server will only send compressed content if the browser says it can handle it. Check if your web site uses compression with our Page Analyzer service. Enter the URL you want to test and when the result comes back, click the green plus sign to expand:

expand

Check for the Content-Encoding header in the response:
compressed_ok

Minify things

By removing white space from all static content such as javascript and css files, you can gain some bandwidth Minifying is most often done in your web application software rather, so how to do it depends on what type of Web application you are running. Read more about minifying here: http://wpmu.org/why-minify/

Reduce image quality

It may sound backwards, but a lot of web sites are sending images to the browser in 300 DPI, that’s great if the user want’s to print the image, but most images are just displayed on the actual web site where 72-96 DPI is sufficient. Not that the very term DPI means that much on web pages, but it still. A good text about the why and how is found here http://www.webdesignerdepot.com/2010/02/the-myth-of-dpi/

Have your cache settings correct.

In a test such as the one in this post, I didn’t want caching to happen because I wanted to illustrate something. If caching had been enabled, the response headers in the image above would have included an ‘Expires’ header. But in real life, you probably want your web server to instruct the browser to cache all static content. Correctly configured caching means that the browser wont download the same logotype, javascript and css files etc. every single time it loads a web page from your server. Google has written a bit about caching as part of their PageSpeed Rules. https://developers.google.com/speed/docs/best-practices/caching

Use a CDN.

A method that actually covers a lot of the above tips all in one is to use a content delivery network (CDN). A CDN provider will store your static content on their servers and serve it for you. Unless you are one of the bigger Internet companies, chances are that the CDN provider have more bandwidth available. They almost always also have more than one physical location, so that a user from Spain gets the content from a server in or near Spain while a UK user gets his content from a server in the UK. The end result is that the user gets his content faster and your server never have to see the traffic. The better CDN providers can also do some of the things like minifying of even image quality reduction automatically for you. So chances are that you end up saving both time and bandwidth.

That’s it

Opinions? Questions? Tell us what you want think in the comments below.

Load testing tools vs page speed tools

In a recent post, we talked about the difference between load testing tools and site monitoring tools. Another quite common question is what the difference is between Load testing tools and page speed tools. They both measure response time and they both are important when it comes to assess the performance of your web site. So what it the difference and which one do I need?

For most webmasters, the answer is probably that you need both. But before we talk about why, let’s try a car analogy.

Your own limousine business

Let’s say that you are the CEO of a limousine business. Every single day, you get a call from a client that wants to be picked up at the airport and taken to the city hotel. You send out one of your cars to pick the client up at the airport. The car navigates through traffic and safely leaves the client at the hotel he wanted to go to. Pretty easy.

Now, every now and then, your drivers report that the client wants to get to the hotel quicker and if your business can’t handle that, the client will switch to another limousine business. Since you don’t want to lose your customer, you take the feedback very seriously and start looking into what you can do about it. If you have any intention to do your work seriously, you’re probably going to start with measuring how long it actually takes to get the client from the airport to the hotel. A sensible thing to measure would be to look at the time elapsed from the client’s phone call until he is left of at his hotel. You also look into how long time it takes after the call until the  car is heading to the airport, how long time it takes to locate the client at the airport and how long time it takes to drive from the airport to the hotel.

After some careful analysis, you end up with a very good understanding of what takes time and you probably have a good idea about some of the things you can do to speed it up. Perhaps you decide to always have a car ready at the airport. You might want to change your stretch limousine car to a Ferrari or even to a motorcycle (an existing service in Paris among other cities) to make the actual trip a bit faster.  There’s a lot of different things you can do to make your service quicker. At some point, you are happy with the performance improvements and when you are, you have optimized your ability to take one client from one destination to another as fast as possible.

What does a limousine have to do with web pages?

Back to the subject of this article. A lot of web masters have received the same type of feedback as you did as CEO of the limousine service. But instead of complaining about how quick the clients gets to the hotel, they complain that your web page feels slow. And in reality, most of your clients won’t even complain, they’ll simply direct their browser to a different web site and never look back.

So, as a web master, you want to do the equivalent of measuring how fast your service is.  To do this, you want to get hold of a page speed measurement tool, and there are plenty to select from. The two most well known tools are Google PageSpeed Tools and Yahoo! YSlow, they don’t stop at measuring the actual page load times, they also give you a lot of insight into what is considered good enough and what you can do to improve the page load speed.

As you begin to implement various fixes to improve your page load time, you most likely go back to your tool of choice and redo your measurements in an iterative process. At some point, you are happy with the performance improvements and when you are, you have optimized your ability to serve one page to one client as fast as possible.

A more complicated limousine service

In reality, the limousine service has a lot of different clients. Not all of them is a single person that want to go from the airport to the hotel.  Some clients is a single person that want to go from the train station to the hotel and another type of client is a party of 10 people that want to go from the hotel to the airport. And sometimes things gets really complicated, you get 100 clients calling pretty much at the same time wanting to go in all kinds of directions. For most business owners, having a lot of clients calling would be a nice problem, but it’s even more important to be able to keep the service level high, otherwise you just get a lot of disappointed clients, fast.

So, some of the optimizations you made to serve one client really quick will still be valid. Having cars waiting at the airport probably still makes sense, but should you really have a Ferrari or a motorcycle waiting there? Perhaps the stretch limousine that takes 10 passengers was a pretty good thing after all, or a mix? Clearly, this is a much more complicated thing to measure and optimize and to be honest, if I was the CEO of the limousine service, I would have to think hard to even know where to begin.

Load testing tools

The purpose of load testing tools is to help you simulate how your web site performs when you have a lot of clients at the same time. You will find out that some of the optimizations you made to make a single page load really quick makes perfect sense also when you have a lot of concurrent clients. But other optimizations actually makes things worse. An example would be database optimizations,  the very indexes that makes the web page super fast as long as the page only require good read performance may hurt you a lot when some client requests are writing to the same tables at the same time. Another example may be memory consumption. When one single web page is being requested, a script that uses a lot of memory can go unnoticed or even speed things up, but in a high load scenario, high memory consumption would almost certainly hurt performance when the web server starts to run out of memory.

So if I was a web master, I do have a pretty good idea where to begin when optimizing a web site for many concurrent users. I would start with a load testing tool.

Load testing tools vs page speed tools

Back to the original question. What is the difference between load testing tools and page speed tools and which one should I use? Again, the answer is that you probably should use both.

Fast loading web pages is crucial so you should absolutely use one of the page speed tools available. Web users turn their back to slow pages faster than you can type Google PageSpeed Tools in your search bar.  And the bonus is that a lot of the things you do to optimize single page load times are going to help performance also in high load scenarios.

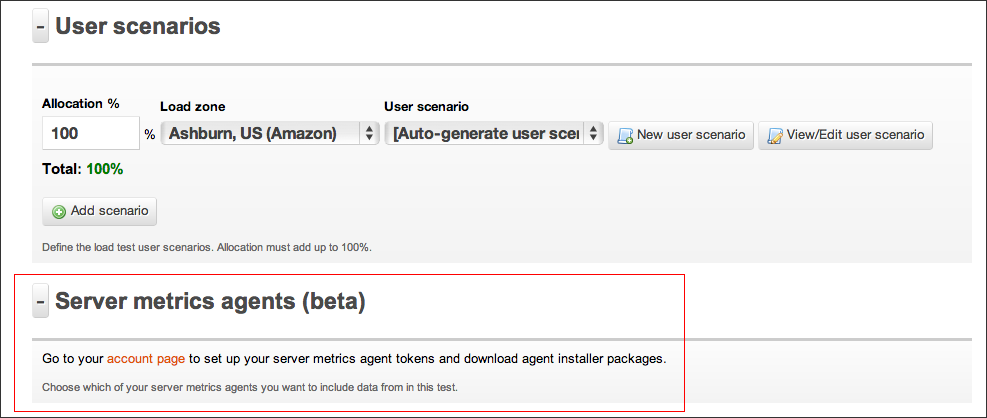
Fast loading web pages that keep working when you have a lot of visitors is perhaps even more crucial. At least if your web business relies on being able to serve users. If you want to know how your web page performs when you have 10, 100 or even 10000 users at the same time, you need to test this with a load testing tool such as loadimpact.com/

Opinions? Questions? Tell us what you want think in the comments below.

On load testing and performance April-13

What are others are saying about load testing and web performance as of now? Well, apparently more people have things to say about how to make things scale rather than how to measure it, but anyway, this is what cought our attention recently:

  • Boundary.com has a two part interview with Todd Hoff, founder of High Scalability and advisor to several start ups. Read the first part here: Facebook Secrets of web performance
  • Another insight in how the big ones are doing it is this 30 minute video from this years Pycon US. Rick Branson of Instagram talks about how they handle their load as well as the Justin Bieber effect.
  • The marketing part of the world have really started to understand how page load times affect sales as well as Google rankings. In this article Online marketing experts portent.com explains all the loops and hoops they went trough to get to sub second page load time. Interesting read indeed.
  • One of my favorite sources for LAMP related performance insights is the MySQL performance blog. In a post from last week, they explain a bit about how to use their tools to analyze high load problems.
What big load testing or web performance news did we miss? Have your say in the comments below.

Load testing tools vs monitoring tools

So, what’s the difference between a load testing tool (such as http://loadimpact.com/) and a site monitoring tool such as Pingdom (https://www.pingdom.com/). The answer might seem obvious to all you industry experts out there, but nevertheless it’s a question we sometimes get. They are different tools used for different things, so an explanation is called for.

Load testing tools

With a load testing tool, you create a large amount of traffic to your website and measure what happens to it. The most obvious measurement is to see how the response time differs when the web site is under the load created by the traffic. Generally, you want to find out either how many concurrent users your website can handle or you want to look at the response times for a given amount of concurrent users. Think of it as success simulation: What happens if I have thousands of customers in my web shop at the same time. Will it break for everyone or will I actually sell more? Knowing a bit about how your website reacts under load, you may want to dig deeper and examine why it reacts the way it does. When doing this, you want to keep track of various indicators on the web site itself while it receives a lot of traffic. How much memory is consumed? How much time spent waiting for disk reads and write? What’s the database response time? etc. Load Impact offers server metrics as a way to help you do this. By watching how your webserver (or servers) consume resources, you gradually build better and better understanding about how your web application can be improved to handle more load or just to improve response times under load. Next up, you may want to start using the load testing tool as a development tool. You make changes that you believe will change the characteristics of your web application and then you make another measurement. As you understand more and more about the potential performance problems in your specific web application, you iterate towards more performance.

Monitoring tools

A site monitoring tool, such as Pingdom (https://www.pingdom.com/), might be related, but is a rather different creature. A site monitoring tool will send requests to your web site on a regular interval. If your web site doesn’t respond at all or, slightly more advanced, answers with some type of error message, you will be notified. An advanced site monitoring tool can check your web site very often, once every minute for instance. It will also test from various locations around the world to be able to catch network problems between you and your customers. A site monitoring tool should be able to notify you by email and SMS as soon as something happens to your site. You are typically able to set rules for when your are notified and for what events, such as ‘completely down’, ‘slow response time’ or ‘error message on your front page’ In recent years, functionality have gotten more advanced and beside just checking if your web site is up, you can test entire work flows are working, for instance if your customers can place an item in the shopping card and check out. Most site monitoring tools also include reporting so that you can find out what your service level have been like historically. It’s not unusual to find out that the web site you thought had 100% uptime actually has a couple of minutes of down time every month. By proper reporting, you should be able to follow if downtime per month is trending. Sounds like a good tool right? We think it deserves to be mentioned that whenever you detect downtime or slow response time with a site monitoring tool, you typically don’t know why it’s down or slow. But you know you have problems and that’s a very good start.

One or the other?

Having a bit more knowledge about the difference between these types of tools, we also want to shed some light on how these can be used together. First of all, you don’t choose one or the other type of tool, they are simply used for different things. Like measuring tape and a saw, when your building a house you want both. We absolutely recommend that if you depend on your web site being accessible, you should use a site monitoring tool. When fine tuning your web site monitoring tool, you probably want to set a threshold for how long time you allow for a web page to load. If you have conducted a proper load test, you probably know what kind of response times that are acceptable and when the page load times actually indicates that the web server has too much load. Then, when your site monitoring tool suddenly begins to alert you about problems you want to dig down and understand why, that’s when the load testing tool becomes really useful. As long as the reason for your down time can be traced back to a performance problem with the actual web server, a load testing tool can help you a long way. Recently, I had a client that started getting customer service complaints about the web site not working. First step was to set up a web site monitoring tool to get more data in place. Almost directly, the web site monitoring tool in use was giving alerts, the site wasnt always down, but quite often rather slow. The web shop was hosted using standard web hosting package at one of the local companies. I quickly found out that the problem was that the web shop software was just using a lot of server resources and this was very easy to confirm using a load testing tool. Now the client is in the process of moving the site to a Virtual Private Server where resources can be added as we go along. Both types of tools played an important role in solving this problem quickly. Questions? Tell us what you want to know more about in the comments below.

Top 5 ways to improve WordPress under load

WordPress claims that more than 63 million web sites are running the WordPress software. So for a lot of users, understanding how to make WordPress handle load is important. Optimizing WordPress ability to handle load is very closely related to optimizing the general performance, a subject with a lot of opinions out there. We’ve actually talked about this issue before on this blog. Here’s the top 5 things we recommend you do to fix before you write that successful blog post that drives massive amounts of visitors.

#1 – Keep everything clean and up to date

Make sure that everything in WordPress is up to date. While this is not primarily a performance consideration, it’s mostly important for security reasons. But various plugins do gradually become better and better with performance issues, so it’s a good idea to keep WordPress core, all plugins as well as your theme up to date. And do check for updates often, I have 15 active plugins on my blog and I’d say that there’s 4-6 upgrades available per month on average. The other thing to look out for is to keep things clean. Remove all themes and plugins that you don’t currently use. Deactivate and physically delete them. As an example, at the time of writing this. my personal blog had 9 plugins that needed upgrading and I had also let the default WordPress theme in there. I think it’s a pretty common situation so do what I did and make those upgrades.

#2 – Keep the database optimized

There are two ways that WordPress databases can become a performance problem. First is that WordPress stores revisions of all posts and pages automatically. It’s there so that you always can go back to a previous version of a post. As handy as that can be, it also means that the one db table with the most queries gets cluttered. On my blog, I have about 30 posts but 173 rows in the wp_posts table. For any functionality that lists recent posts, related posts and similar, this means that the queries takes longer. Similary, the wp_comments table keeps a copy of all comments that you’ve marked as spam, so the wp_comments table may also gradually grow to become a performance problem. The other way that you can optimize the WordPress database is to have mysql do some internal cleanup. Over time the internal structure of the mysql tables also becomes a cluttered. Mysql provides an internal command for this: ‘optimze table [table_name]’. Running optimize table can improve query performance a couple of percent with in turn improves the page load performance. Instead of using phpmyadmin to manually delete old post revisions and to run the optimize table command, you should use a plugin to do that, for instance WP Optimize. Installing Wp optimize on my blog, it told me that the current database size was 7.8 Mb and that it could potentially remove 1.3 Mb from it. It also tells me that a few important tables can be optimized, for instance wp_options that is used in every single page request that WordPress will ever handle.

#3 – Use a cache plugin

Probably the single most effective way to improve the amount of traffic your WordPress web site can handle is to use a cache plugin. We’ve tested cache plugins previously on the Load Impact blog, so we feel quite confident about this advice. The plugin that came out on top in our tests a few years ago was W3 Total Cache. Setting up W3 Total Cache requires some attention to details that is well beyond what other WordPress plugins typically requires. My best advice is to read the installation requirements carefully before enabling the page cache functionality since not all features will work on all hosting environments. Read more about various WordPress cache plugins here, but be sure to read the follow up.

#4 – Start using a CDN

By using a CDN (content delivery network), you get two great performance enhancements at once. First of all, web browsers limit the number of concurrent connections to your server, so when downloading all the static content from your WordPress install (css, images, javascripts etc.), they actually queue up since not all of them is downloaded at the same time. By placing as much content as possible on a CDN, you work around this limitation since your static content is now served from a different wen server. The other advantage you get is that CDN typically have more servers than you do and there’s a big chance that (a) one of their servers is closer to the end user than your server and (b) that they have more bandwidth than you do. There are a number of ways you can add CDN to your WordPress install. W3 Total Cache from #3 above handles several CDN providers (Cloudflare, Amazon, Rackspace) or even lets you provide your own. Another great alternative is to use the CloudFlare WordPress plugin that they provide themselves.

#5 Optimize images (and css/js)

Looking at the content that needs to be downloaded, regardless if it’s from a CDN or from your own server, it makes sense to optimize it. For css and js files, a modern CDN provider like CloudFlare can actually minify it for you. And if you don’t go all the way to use an external CDN, the W3 Total Cache plugin can also do it for you. For images you want to keep the downloaded size as low as possible. Yahoo! has an image optimizer called Smush.it that will drastically reduce the file size of an image, while not reducing quality. But rather than dealing with every image individually, you can use a great plugin name WP-Smushit that does this for you as you go along.

Conclusion and next step

There are lots and lots of content online that will help you optimize WordPress performance and I guess it’s no secret that these top 5 tips are not the end of it. In the next post, I will show you how a few of these advises measures up in reality in the LoadImpact test bench.

About Load Impact

Load Impact is the leading cloud-based load testing software trusted by over 123,000 website, mobile app and API developers worldwide.

Companies like JWT, NASDAQ, The European Space Agency and ServiceNow have used Load Impact to detect, predict, and analyze performance problems.
 
Load Impact requires no download or installation, is completely free to try, and users can start a test with just one click.
 
Test your website, app or API at loadimpact.com

Enter your email address to follow this blog and receive notifications of new posts by email.