Announcing the Load Impact API beta

We are pleased to announce the Load Impact API beta!

the developer.loadimpact.com API documentation site

For people who do not know what an API is, or what it is good for, our API allows you to do basically everything you can do when logged in at loadimpact.com, like configure a load test, run a load test, download results data from a load test. But the API can be used by another program, communicating with Load Impact over the Internet. This means that a developer can write an application that will be able to use our API functionality to configure and run load tests on the Load Impact infrastructure – and this can happen completely without human involvement, if the developer chooses it.

The API is very useful for companies with a mature development process, where they e.g. do nightly builds – and run automated tests – on their software. The API allows them to include load tests in their automated test suites, and in that way monitor the performance and scalability of their application while it is being developed. This is useful in order to get an early indication that some piece of newly produced code doesn’t perform well under load/stress. The earlier such problems are detected, the less risk of developers wasting time working on code tracks that don’t meet the performance criteria set up for the application.

The API can also be used by other online services or applications, that want to include load testing functionality as part of the service/product, but where it is preferable to avoid building from scratch a complete load testing solution like Load Impact. They can use our API to integrate load testing functionality as part of their own product, with Load Impact providing that functionality for them.

We have created a whole new documentation section for the API at http://developer.loadimpact.com where you can find the API reference and some code examples. We will be delighted to hear from you if you are using the API, so don’t hesitate to get in touch with us! Feedback or questions are very welcome!


Know your node.js

As part of a follow up to last months column about PHP vs Node.js, I hit some problems with Node under load. As with all technologies, Node.js does have some limitations that may or may not be a problem for your specific use case. If the last column about comparing PHP and Node.js had a deeper message, that message would be that if you want to scale you have to know your stack. To be completely clear, when I say stack I mean the layers of technology used to server http requests. One of the most common stacks out there are simply called LAMP – (L)inux (A)pache2 (M)ySQL (P)HP (or Perl). You now see a lot of references to LNMP, where Apache2 is replaced with Nginx. When building Node.js applications, things can vary a lot since node.js comes with it’s own http server. In my previous text, I used Node.js together with MySQL on a Linux box, so I guess we can dub that the LNM stack if we absolutely need to have a name for it. And when I say Know your stack. I mean that if you want to produce better than average performance numbers, you have to be better than average in understanding how the different parts in your stack works together. There are hundreds of little things that most of us never knew mattered that suddenly becomes important when things come under load. As it happens, watching your application work under load is a great way to force yourself to know your stack a little better.

Background

When testing Apache/PHP against Node.js, I found that the raw performance of Node.js as well as the ability to handle many concurrent clients was excellent. Faster and more scalable than Apache2/PHP. One reader pointed out that the test wasn’t very realistic since there was just one single resource being queried and there was no static content involved. Apache2/PHP could very well relatively better if some of the content was static. So I set up a test to check this and while running this. Node.js crashed. As in stopped working. As in would not server any more http reqeusts without manual intervention. So to keep it shord, Apach2/PHP won that round. But in the spirit of ‘know your stack’, we need to understand why Node.js crashed. The error message I got was this:

Unhandled 'error' event "events.js:71"

First of all, it took a fair amout of googling to figure out what that the error message was really about. Or, rather, the error message was saying that something happened and there’s no error handler for it. So good luck.

Fixing it.

The first indication I got via Google and Stack Overflow was that this may be an issue with Node.js before 0.8.22 and sure enough, I was running 0.8.19. So the first thing I did was upgrade to version 0.8.22. But that did not fix the problem at all (but a later and greater version is of course a nice side effect). With almost all other software involved being up to date, this actually required some structured problem solving.

Back to the drawing board

I eventually managed to trace the error message down to a ‘too many open files’ problem which is Interesting as it answers the crucial question: What went wong? This happened at roughly 250 concurrent users with a test that was accessing 6 different static files. This is what it looks like in LoadImpact:

node_failed_test

So a little depending on timing, and exactly when each request comes in, it would roughly indicate that some 1500 (6 files times 250 users) files can be open at the same time. Give or take. Most Linux systems are, by default, configured to allow relatively small number of open files, e.g. 1024. The Linux command to check this is ulimit:

$ ulimit -n
1024

1024 is the default on a lot of distros, including Ubuntu 12.10 that I was running the tests on. So my machine had 1024 as the limit but it appears that I had 1500 files open at the same time. Does this make any sense? Well, sort of, there are at least 3 factors involved here that would affect the results:

  1. Load Impact simulates real browsers (Virtual Users). A VU user only opens 4 concurrent connections to the same server even if the script tells it to download 6 resources. The other 2 resources are simply queued.
  2. Each open TCP socket counts as an open file. So each concurrent TCP connection is an open file. Knowing that our limit is 1024, that would indicate that node.js could handle up to 256 concurrent users if each user uses the maximum of 4 open connections.
  3. In our sample, the requests for static resources also opens a file and thereby occupies another file handle. This file is open for less time than the actual connection, but still, under a certain time, a single request can consume 2 open file handles.

So in theory, the limit for concurrent simulated browser users should be 256 or less. But in reality, I saw the number of concurrent users go all the way up to 270 before the Node.js process died on me. The explanation to that is more likely than anything just timing. Not all VU’s will hit the server at exactly the same time. At the end, hitting problems when running about 250 concurrent users reasons well with the open files limit being the problem. Luckily, the limit of number of open files per process is easy to change:

$ ulimit -n 2048

The next test shows real progress. Here’s the graph:

node_better_test

Problem solved (at least within the limits of this test).

Summary

Understanding what you build upon is important. If you choose to rely on node.js, you probably want to be aware of how that increases your dependency on various per process limitations in the operating system in general and max number of open files in particular. You are more affected by these limitations since everything you do takes place inside a single process. And yes. I know. There are numerous of more or less fantastic ways to work around this particular limitation. Just as there are plenty of ways to work around limitations in any other web development stack. The key thing to remember is that when you select your stack, framework, language or server, you also select all the limitations that comes with it. There’s (still) no silver bullet, even if some bullets are better out of the box than other. Having spent countless of hours with other web development languages, I think I’m in a good position to compare and yes indeed! Node.js delivers some amazing performance. But at present, it comes with a bigger responsibility to ‘Know Your stack’ than a lot of the others.

Node.js vs PHP – using Load Impact to visualize node.js efficiency

It could be said that Node.js is the new darling of web server technology. LinkedIn have had very good results with it and there are places on the Internet that will tell you it can cure cancer.

In the mean time, the old work horse language of the Internet, PHP, gets a steady stream of criticism. and among the 14k Google hits for “PHP sucks” (exact term), people will say the most funny terrible things about the language while some of the critique is actually quite well balanced. Node.js introduces at least two new things (for a broader audience). First, the ability to write server side JavaScript code. In theory this could be an advantage since JavaScript is more important than ever on the client side and using the same language on server and browser would have many benefits. That’s at least quite cool.

The other thing that makes Node.js different is that it’s completely asynchronous and event driven. Node is based on the realization that a lot of computer code actually just sits idle and wait for I/O most of the time, like waiting for a file to be written to disk or for a MySQL query to return data. To accomplish that, more or less every single function in Node.js is non-blocking.

When you ask for node to open a file, you don’t wait for it to return. Instead, you tell node what function to pass the results to and get on with executing other statements. This leads to a dramatically different way to structure your code with deeply nested callbacks and anonymous function and closures. You end up with something  like this:

doSomething(val, function(err,result){
  doSomethingElse(result,function(err,res){
    doAbra();
    doKadabra(err, res, function() {
      ...
      ...
    });
  });
});

It’s quite easy to end up with very deep nesting that in my opinion sometimes affects code readability in a negative way. But compared to what gets said about PHP, that’s very mild critique. And.. oh! The third thing that is quite different is that in Node.js, you don’t have to use a separate http(s) server. It’s quite common to put Node.js behind a Nginx, but that’s not strictly needed. So the heart of a typical Node.js web application is the implementation of the actual web server.

A fair way to compare

So no, it’s not fair to say that we compare Node.js and PHP. What we really compare is Node.js and PHP+Apache2 (or any other http server). For this article, I’ve used Apache2 and mod_php since it’s by far the most common configuration. Some might say that I’d get much better results if I had used Nginx or Lighthttpd as the http server for PHP. That’s most likely very true, but at the end of the day, server side PHP depends on running in multiple separate processes. Regardless if we create those processes with mod_php or fastcgi or any other mechanism. So, I’m sticking with the standard server setup for PHP and I think that makes good sense.

The testing environment

So we’re pitting PHP+Apache2 against a Node.js based application. To keep things reasonable, I’ve created a very (really, very) simple application in both PHP5 and Node.js. The application will get 50 rows of data from a WordPress installation and output it as a json string. That’s it, nothing more. The benefit of keeping it this simple was (a) that I didn’t have to bother about too many implementation details between the two languages and (b) more important that we’re not testing my ability to code, we’re really testing the difference in architecture between the two. The server we’re  using for this test is a virtual server with:

  • 1 x Core Intel(R) Xeon(R) CPU E5-2670 0 @ 2.60GHz
  • 2 Gb RAM.
  • OS is 64 Bit Ubuntu 12.10 installed fresh before running these tests.
  • We installed the Load Impact Server metric agent.

For the tests, we’re using:

  • Apache/2.2.22 and
  • PHP 5.4.6.
  • Node.js version 0.8.18 (built using this script)
  • MySQL is version 5.5.29.
  • The data table in the tests is the options table from a random WordPress blog.
The scripts we’re using:

Node.js (javascript):

// Include http module,
var http = require('http'),
mysql = require("mysql");

// Create the connection.
// Data is default to new mysql installation and should be changed according to your configuration.
var connection = mysql.createConnection({
   user: "wp",
   password: "****",
   database: "random"
});

// Create the http server.
http.createServer(function (request, response) {
   // Attach listener on end event.
   request.on('end', function () {

      // Query the database.
      connection.query('SELECT * FROM wp_options limit 50;', function (error, rows, fields) {
         response.writeHead(200, {
            'Content-Type': 'text/html'
         });
         // Send data as JSON string.
         // Rows variable holds the result of the query.
         response.end(JSON.stringify(rows));
      });
   });
// Listen on the 8080 port.
}).listen(8080);

PHP code:

<!--?php $db = new PDO('mysql:host=localhost;dbname=*****',     'wp',     '*****'); $all= $db--->query('SELECT * FROM wp_options limit 50;')->fetchAll();
echo json_encode($all);

The PHP script is obviously much shorter, but on the other hand it doesn’t have to implement a full http server either.

Running the tests

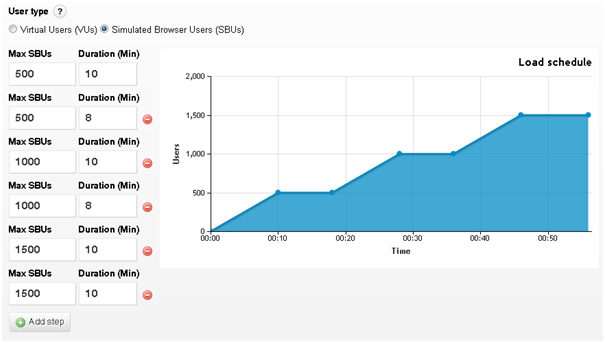
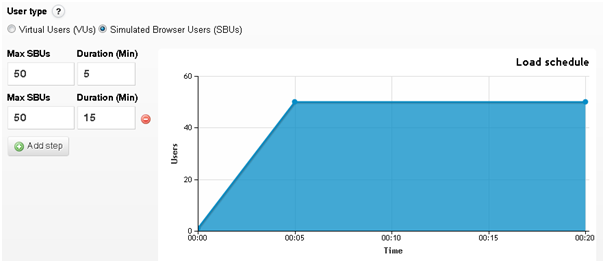
The Load Impact test configurations are also very simple, these two scripts are after all typical one trick ponies, so there’s not that much of bells and whistles to use here. To be honest, I was surprised how many concurrent users I had to use in order to bring the difference out into the light. The test scripts had the following parameters:

  • The ramp up went from 0-500 users in 5 minutes
  • 100% of the traffic comes from one source (Ashburn US)
  • Server metrics agent enabled
The graphics:
On the below images. the lines have the following meanings:
  • Green line: Concurrent users
  • Blue line: Response time
  • Red line: Server CPU usage

Node.js up to 500 users.

The first graph here shows what happens when we load test the Node.js server. The response time (blue) is pretty much constant all through the test. My back of a napkin analysis of the initial outliers is that they have to do with a cold MySQL cache. Now, have a look at the results from the PHP test:

Quite different results. It’s not easy to see on this screen shot, but the blue lines is initially stable at 320 ms response time up to about 340 active concurrent users. After that, we first see a small increase in response time but after additional active concurrent users are added, the response time eventually goes through the roof completely.

So what’s wrong with PHP/Apache?

Ok, so what we’re looking at is not very surprising, it’s the difference in architecture between the two solutions. Let’s think about what goes on in each case.

When Apache2 serves up the PHP page it leaves the PHP execution to a specific child process. That child process can only handle one PHP request at a time so if there are more requests than than, the others have to wait. On this server, there’s a maximum of 256 clients (MaxClients) configured vs 150 that comes standard. Even if it’s possible to increase MaxClients to well beyond 256, that will in turn give you a problem with internal memory (RAM). At the end, you need to find the correct balance between max nr of concurrent requests and available server resources.

But for Node, it’s easier. First of all, in the calm territory, each request is about 30% faster than for PHP, so in pure performance in this extremely basic setup, Node is quicker. Also going for Node is the fact that everything is in one single process on the server. One process with one active request handling thread. So thre’s no inter process communication between different instances and the ‘mother’ process. Also, per request, Node is much more memory efficient. PHP/Apache needs to have a lot of php and process overhead per concurrent worker/client while Node will share most of it’s memory between the requests.

Also note that in both these tests, CPU load was never a problem. Even if CPU loads varies with concurrent users in both tests it stays below 5% (and yes, I did not just rely on the graph, I checked it on the server as well). (I’ll write a follow up on this article at some point when I can include server memory usage as well). So we haven’t loaded this server into oblivion in any way, we’ve just loaded it hard enough for the PHP/Aapache architecture to start showing some of it’s problems.

So if Node.js is so good…

Well of course. There are challenges with Node, both technical and cultural. On the technical side, the core design idea in Node is to have one process with one thread makes it a bit of a challenge to scale up on a multi core server. You may have already noted that the test machine uses only one core which is an unfair advantage to Node. If it had 2 cores, PHP/Apache would have been able to use that, but for Node to do the same, you have to do some tricks.

On the cultural side, PHP is still “everywhere” and Node is not. So if you decide to go with Node, you need to prepare to do a lot more work yourself, there’s simply nowhere near as many coders, web hotels, computer book authors, world leading CMS’es and what have you. With PHP, you never walk alone.

Conclusion

Hopefully, this shows the inherit differences in two different server technologies. One old trusted and one young and trending. Hopefully it’s apparent that your core technical choices will affect your server performance and in the end, how much load you can take. Designing for high load and high scalability begins early in the process, before the first line of code is ever written.

And sure, in real life, there are numerous of tricks available to reduce the effects seen here. In real life, lots of Facebook still runs on PHP.

21/12/12 – It’s the end of the world… Again!

With all the hype stating that the end of the world would arrive on the 21 Dec, 2012, we decided that we had to do something.

So in honour of our 666,666th test since our launch in 2009, we fired up a quick test on the Vatican. It seems we have been slightly too popular though, so we were placed in queue and only got executed as the 666,668th test 😛

Simple load test, nothing heavy. (You can try a free test here as well). But the results did give some of us at Load Impact a little scare. Take a look at the graphs below:

Coincidence that it looked somewhat like the Crucifix, perhaps? But one thing is to be sure – Don’t mess with the universal forces 😉

Load generation from Australia

A few days ago Amazon announced the availability of its new AWS data center in Sydney, Australia. We here at Load Impact are now happy to announce that we have implemented support for load tests from the Sydney data center.

This means that we are now able to generate simulated user traffic from 8 different locations around the globe:

  • Palo Alto, California, USA
  • Portland, Oregon, USA
  • Ashburn, Virginia, USA
  • Sao Paolo, Brazil
  • Dublin, Ireland
  • Singapore, Singapore
  • Tokyo, Japan
  • Sydney, Australia

You are of course also able to use multiple locations where your traffic is generated, in a single load test. This is something unique to Load Impact that other services don’t offer.

Some other new things we have released recently include:

  • Parallel deployment of test configurations for large tests – This will drastically reduce the time it takes to start larger load tests. Where previously we configured all involved load generator cloud instances in a load test sequentially, we now configure them in parallel.
  • Graceful test shutdown – Previously, when a test was completed, the load generator instances would be killed abruptly. This meant that tests usually ended at the exact moment they were supposed to, but it also meant that some transactions that were “in transit” would never be recorded by Load Impact, even though they might appear in the logs on the web server. To make this less likely to happen, we have now started shutting down tests more gracefully than before, waiting a little bit for all simulated clients to be done with their current transactions. This means that while earlier, all clients in a test would just disappear when the test ended, you will now see a short ramp-down period where the number of clients ramps down quickly from whatever level you were at, to zero.
  • Various bug fixes and improvements – We have implemented lots of smaller bug fixes and improvements, for example in script validation, script conversion, user session handling, etc.

Simulating realistic load using Load Impact

We’ve had this question posed a couple of times in the past, so we thought a blog article might help to clarify how a load test is being executed.

Load Impact’s basic functionality is geared towards simulating user behavior on your site in the most realistic way possible. In a real live situation, if you were to have 500 users on your website at the same time, you probably won’t have all 500 of them on the same page. Some users might also take time to read material on the page, so not all your users will be loading resources. Load Impact tries to simulate that as realistically as possible. An easy way to do this would be to use one of our features called the Proxy Recorder, which helps you in creating a script simulating a user visiting several pages on your site.

When you start a recording, a new browser window with your target URL opens, and whatever actions you do there will be recorded. The HTTP requests will then be translated to a script when the recording is over, which you can further edit if necessary.

So when you start a test, what actually happens is that we will start by running your script with one user, and slowly ramp up to i.e. 500 VUs. When the script runs to completion, it will re-run itself until the time runs out. Now if you look at your script, you will see that there is something called “client.sleep”. That is the time that the user spends browsing each page, and serves as a simulation of what real users do. At the same time, since we add clients to your site in a ramp up situation, what you will get is that some users would be on Page 3 of your script while others are just starting on Page 1. This will mean that each page will never be subject to a load of 500 concurrent users loading resources at the same time.

However, it is important for you to know what your testing goals and objectives are prior to the scripting of the test. If your test objectives are to simulate a marketing campaign where you expect most of your traffic to flood to one page, the initial example might not be suitable for you. Instead, you might want to dedicate one user scenario which simulates the repetitive loading of one or two pages.

graphical editor

You could then have a few other scripts simulating browsing around the site, and how the minority user behavior would be.
You can create and modify scripts using our text editor or graphical editor, but generally if you’re intending to modify the script dynamically we highly encourage using the text editor, and if it’s simple editing both the text and graphical editor would work.

Different types of website performance testing, Part 2: Load Testing

Let’s start with load testing. The term, load testing, is rather generic and is the simplest form of performance testing. The goal of such a test is to see how a system would perform under a specific amount of load. When you simulate a load test, you should know:

– How many concurrent users you are expecting on your server
– What transactions (user actions) you would like to simulate
– The duration you would specify to carry out this load test

Determining the number of concurrent users you are expecting on your server
Concurrent simulated users are the number of users you would like to simulate on your site at the same time. This is very different from visitors per day or per month. We wrote a little blog article that describes this more in depth and shows how you can determine this number using Google Analytics.

Once you have determined the number of concurrent users you have on your site, it is always a good idea to run a load test with 1.5 to 2 times the amount of users. This would help to show if your site is at its limits or has more capacity to spare.

Determining the transactions to simulate in a load test
Like in the charity party example shown above, not everyone does the same thing when they go to a party. Some are just there for the free punch, while others are there to network and make donations.

We refer to this as transactions, user actions or user scenarios. In some cases, it is important to simulate as many (or even all) of the transactions that are being carried out on your website as possible. Most site owners or developers have a good idea of which transactions are the most important to their particular service. For e-commerce sites the checkout process might be key, whereas a video streaming transaction might be more important in news-related sites. Beware though – not all web pages are equal.

It is possible that a less used action in your site could create much more load to your servers and cause them to fail. For example, an advertisement or javascript could prevent the rest of the page from rendering in certain browsers, causing the load times to increase dramatically while using up huge amounts of resources.

Scaling up – How long should it take?
Should I ramp up the load in 1 minute? How about 15? Or maybe 3 hours? How long should I hold the load there for? The answer is – as much as we hate hearing it – it depends. If you’re thinking of doing an instant ramp up or holding the load for a long time, you’re probably looking at doing a Spike Test or Endurance Test. We’ll cover more on that in future posts but for now, we’ll focus on running a regular load test that has a gradual ramp up to simulate slightly more than your usual load (1.5 to 2 times the usual load).

If you have a static amount of resources (i.e. a fixed number of servers allocated to you), these systems usually adapt quite quickly and are able to ramp up quite fast. However, if you are dependent on dynamic resources like cloud servers, your system might need some time to acquire the necessary resource from your cloud service provider. Another thing to note is that if you have a smaller site with limited resources, you should scale up less quickly so you can see where the site starts to fall apart. If you’re in doubt, Load Impact does provide some default recommendations for your ramp up.

These are just suggestions though, but the ground rule is that unless you are looking at simulating a Spike Test (covered later in our stress testing post), we would recommend giving more time for your test to ramp up in order to better simulate actual user behavior.

If you are ramping up to a large number of concurrent users, consider a test configuration like below, where the test ramps up in stages in order to ensure that your site is able to handle certain levels of load with ease before moving on to the next load level.

If you are using Load Impact, remember that the test runs through the entire load script, including sleeps (https://loadimpact.com/learning-center/faq/sleep-time), before it is able to report any results. This means that if your load script is several minutes long, it is a good idea to ramp up the test until a certain level and hold it there for a period of time to ensure that the results reported are for that load level.

Different types of website performance testing, Part 1: The basics

There are plenty of types of testing to keep track on out there, and it doesn’t make it easier that many companies are coming out with their own load testing names. In this series of articles, we will talk about several common types of performance tests that you can carry out on your website and how you can configure your test execution plan to carry out these tests. Note that most of these tips are catered for small and medium enterprises, and might not apply for larger companies.

The basics – What is a performance test, and why should I care?
Let’s say you want to throw an open charity party, where anyone and everyone is invited. You want as many people to come, have a great time and hopefully donate some money in the process. You’ve spent weeks decorating the shop, preparing and sending all the invites and nudging people to spread the word. The response is phenomenal – everyone wants to come! But here’s where your problems begin.

Because your gate is too small, your guests are stuck queuing at the front doors. No one was directed to specific parking places, and there just aren’t enough staff to mop up the punch that keeps spilling on the floor. The music is deafening the guests in the concierge and one of the staff who is supposed to collect the donations called in sick and a replacement isn’t available… The list goes on and on.

The party was a success, yes, but also a resounding failure. One third your guests left before they got to even hear about the charity. A second third felt that your services were both slow and unreliable and went home grumbling about it. The rest of the party had a ball, but could’ve had a better experience.

Sounds familiar? The same thing happens when you launch your website as well. Lots of work goes into sprucing up the decorations, creating advertising campaigns and pushing for your website to ‘go viral’. When traffic floods in, however, many websites find that they aren’t built for the load and end up  failing when it is most vital.

What website performance testing does is that it simulates a party at your shop before the day of the party itself. This allows you to see if your gate (bandwidth) is too little, traffic direction (load balancing) issues are smooth, or if your customer service times (load times) are too long. By load testing, you can save yourself a lot of worry on the day of the party and give your customers a much better experience.

If you’ve never explored the possibilities of testing your website’s performance before, the information might be overwhelming. To understand the whole process in detail, you will first need to learn about the different types of testing you can perform.

Some common types of performance tests are:
– Load tests
– Stress tests
– Endurance tests

Some articles might also talk about
– Configuration tests
– Failover tests
– Isolation tests
These terms serve more to be the goals of the test rather than the method of running the performance test itself.

In following weeks we will have a series of blog posts that will cover each type of performance test and lead you through a more thorough explanation of these load testing goals.

iPhone 5 – Apple was ready for it this time

Apple handled the load during iPhone 5-launch

Load problems is almost a tradition when Apple launches new iPhones. When the iPhone 4s was launched the whole website went down and when Apple started taking preorders for iPhone 4 the Apple Store went down.

But no such problems when iPhone 5 was released together with new iPods, EarPods and iOS6. According to our measurements www.apple.com loaded just as fast as usual. Maybe Apple did their homework this time?

The average response time for www.apple.com in our measurements is between 30 and 100 milliseconds on a normal day. During the launch of the iPhone 5 there were no detectable differences in response time. As usual the Apple Store was closed during the event.

We’ll see what happens with reponse time when Apple Store opens up for preorders of the new iPhone 5 on September 14.

If you want to see the response time graphs for http://www.apple.com and Apple Store, check out the previous blog entry

iPhone 5 – is Apple ready for it, part 2

It is now about 2 hours after the iPhone 5 was revealed. Apple Store has reopened after being taken offline to get updated with new content.

We have not seen any major problems with the sites this time. Well, apart from Apple Store being completely inaccessible for a few hours while being updated of course (do they really have to do that, or is it some marketing stunt?  Seems a bit primitive to have to take the whole thing offline just to update some content).

The main website – http://www.apple.com – seems to have worked fine during the whole event. It remains to be seen if Apple Store works as well now after the event as it did before it, or if it will suffer from huge numbers of iPhone 5-shoppers checking out details and availability of the new phone.

Here are a couple of graphs showing response time statistics during the launch and a short while afterwards.


About Load Impact

Load Impact is the leading cloud-based load testing software trusted by over 123,000 website, mobile app and API developers worldwide.

Companies like JWT, NASDAQ, The European Space Agency and ServiceNow have used Load Impact to detect, predict, and analyze performance problems.
 
Load Impact requires no download or installation, is completely free to try, and users can start a test with just one click.
 
Test your website, app or API at loadimpact.com

Enter your email address to follow this blog and receive notifications of new posts by email.