Uncover Hidden Performance Issues Through Continuous Testing

On-premise test tools, APMs, CEMs and server/network based monitoring solutions may not be giving you a holistic picture of your system’s performance; cloud-based continuous testing can.  

When it comes to application performance a wide array of potential causes of performance issues and end user dissatisfaction exist.  It is helpful to view the entire environment, from end user browser or mobile device all the way through to the web and application servers, as the complex system that it is.

system

Everything between the user’s browser or mobile and your code can affect performance

The state of the art in application performance monitoring has evolved to include on-premise test tools, Application Performance Management (APM) solutions, customer experience monitoring (CEM) solutions, server and network based monitoring. All of these technologies seek to determine root causes of performance problems, real or perceived by end users. Each of these technologies has it’s own merits and costs and seek to tackle the problem from different angles. Often a multifaceted approach is required when high value, mission critical applications are being developed and deployed.

On-premise solutions can blast the environment with 10+Gbit/sec of traffic in order to stress routers, switches and servers. These solutions can be quite complex and costly, and are typically used to validate new technology before it can be deployed in the enterprise.

APM solutions can be very effective in determining if network issues are causing performance problems or if the root cause is elsewhere. They will typically take packet data from a switch SPAN port or TAP (test access point), or possibly a tap-aggregation solution. APM solutions are typically “always-on” and can be an early warning system detecting applications problems before the help desk knows about an issue.  These systems can also be very complex and will require training & professional services to get the maximum value.

What all of these solutions lack is a holistic view of the system which has to take into account edge devices (Firewalls, Anti-Malware, IPS, etc), network connectivity and even endpoint challenges such as packet loss and latency of mobile connections. Cloud-based testing platforms such as Load Impact allow both developers and application owners to implement a continuous testing methodology that can shed light on issues that can impact application performance that might be missed by other solutions.

A simply way to accomplish this is to perform a long-term (1 to 24+ hr) application response test to look for anomalies that can crop up at certain times of day.  In this example I compressed the timescale and introduced my own anomalies to illustrate the effects of common infrastructure changes.

The test environment is built on an esxi platform and includes a 10gbit virtual network, 1gbit physical LAN, Untangle NG Firewall and a 50/5 mbit/sec internet link.  For the purposes of this test the production configuration of the Untangle NG Firewall was left intact – including Firewall rules, IPS protections however QoS was disabled.  Turnkey Linux was used for the Ubuntu-based Apache webserver with 8 CPU cores and 2 gigs of ram.

It was surprising to me what did impact response times and what had no effect whatsoever.  Here are a few examples:

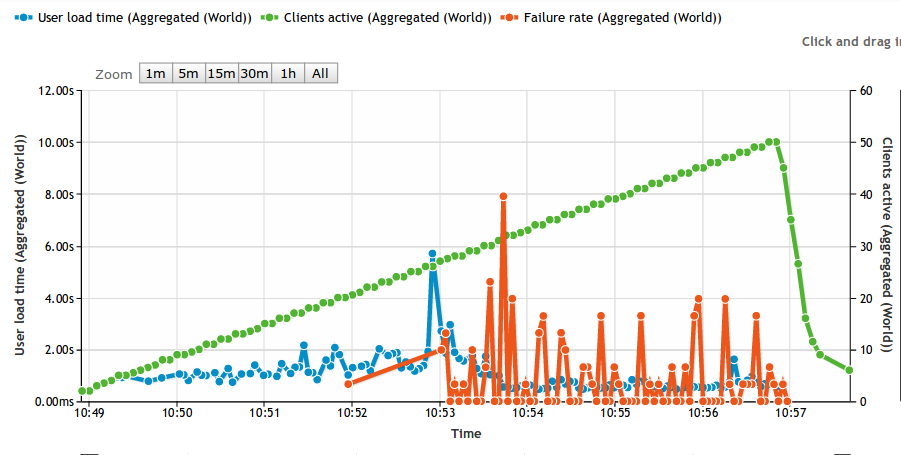
First up is the impact of bandwidth consumption on the link serving the webserver farm.  This was accomplished by saturating the download link with traffic, and as expected it had a dramatic impact on application response time:

Impact of download activity on application response times

At approx 14:13 link saturation occurred (50Mbit) and application response times nearly tripled as a result

bandwidth

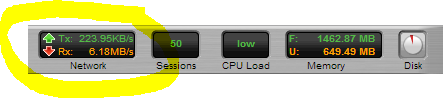
Snapshot of the Untangle Firewall throughput during link saturation testing

Next up is executing a Vmware snapshot of the webserver.  I fully expected this to impact response times significantly, but the impact is brief.  If this was a larger VM then the impact could have been longer in duration:

impact-of-snapshot-on-apache-VM

This almost 4x spike in response time only lasts a few seconds and is the result of a VM snapshot

Lastly was a test to simulate network congestion on the LAN segment where the webserver is running.  

This test was accomplished using Iperf to generate 6+ Gbit/sec of network traffic to the webserver VM.  While I fully expected this to impact server response times, the fact that it did not is a testament to how good the 10gig vmxnet3 network driver is:

iperf

Using Iperf to generate a link-saturating 15+Gbit/sec of traffic to Apache (Ubuntu on VM)


simulate network congestion using iperf 2

In this test approx 5.5Gbit/sec was generated to the webserver,no impact whatsoever in response times

Taking a continuous monitoring approach for application performance has benefits to not only application developers and owners, but those responsible for network, security and server infrastructure.  The ability to pinpoint the moment when performance degrades and correlate that with server resources (using the Load Impact Server Metrics Agent) and other external events is very powerful.  

Often times application owners do not have control or visibility into the entire infrastructure and having concrete “when and where” evidence makes having conversations with other teams in the organization more productive.

———-

Peter CannellThis post was written by Peter Cannell. Peter has been a sales and engineering professional in the IT industry for over 15 years. His experience spans multiple disciplines including Networking, Security, Virtualization and Applications. He enjoys writing about technology and offering a practical perspective to new technologies and how they can be deployed. Follow Peter on his blog or connect with him on Linkedin.

WordPress Vertical Scalability Part I: How Performance Varies with Changes in Hardware

How does your web application respond to improvements in the underlying hardware? Well, that will depend a lot on your application. Different applications are limited by different factors such as RAM, CPU, bandwidth, disk speed to name a few. In this article, I’ll show you an approach to finding out how to test your way to understanding how your application consumes resources.

At some point in the development cycle, preferably early, it makes good sense to narrow down what factors limit your application the most. It’s also useful to flip that statement around and ask yourself: what hardware improvements will benefit your overall performance the most? If you focus on the latter of the two statements, the solution is probably the most important information you need for good resource planning.

To demonstrate the concept of vertical scalability testing, (or hardware sensitivity testing), I’ve set up a very simple WordPress 3.8.1 installation and will examine how performance varies with changes in hardware. The tests are made using virtual machines where hardware changes are easy to make. I’ve created a simple but somewhat credible user scenario using the Load Impact User Scenario Recorder for Chrome.

The simulated users will:

  •  Surf to the test site
  •  Use the search box to search for an article
  •  Surf to the first hit in the search results
  •  Go back to the home page

The baseline configuration is very conservative:

  • CPU: 1 core
  • RAM: 128 Gb
  • Standard disks.

The test itself is a basic ramp up test going from 0 to 50 concurrent users. Based on experience from previous tests with WordPress, a low power server like this should not be able to handle 50 concurrent users running stock WordPress. The idea is to run the test until we start seeing failures. The longer it takes before we see failures, the better. In the graph below, the green line is number of simulated users, the blue line is average response time and the red line is the failure rate measured as number of failed requests/s. As you can see, the first failed requests are reported at 20 concurrent users.

baseline

A comment on the response times (blue line) going down. At a high enough load, nearly 100% of all responses are error messages. Typically, the error happens early in the request and no real work is carried out on the server. So don’t be fooled by falling response times as we add load, it just means that the server is quick to generate an error.


RAM Memory sensitivity

First, I’m interested to see how performance varies with available RAM. I’ve made the point in previous articles that many PHP based web applications are surprisingly hungry for RAM. So let’s see how our baseline changes with increased RAM:

At 256 Mb RAM (2x baseline):

RAM256

At 512  Mb RAM (4x baseline)

RAM512


That’s a quite nice correlation. We see that the number of simulated users that can be handled without a failure is moved higher and higher. At 1024 Mb RAM (8x baseline) we actually don’t get any error at all:

RAM1024

Also note that before the WordPress server spits out errors, there’s a clear indication on the response times. At a light load, any configuration can manage about 1s response time, but as the load increases and we’re nearing the point where we see errors, response times have already gone up.


Sensitivity to CPU cores

Next angle is to look at CPU core sensitivity. With more CPU available, things should move faster, right? RAM memory has been reset to 128 Mb, but now I’m adding CPU cores:

Using 2 CPU cores (2x baseline)

2xCPU

Ops! As you can see, this is fairly close to the baseline. First errors start happening at 20 concurrent users, so more CPU couldn’t do anything to help the situation once we run out of memory. For the sake of completeness, looking at using 4 CPU cores shows a tiny improvement, first errors appear at 23 concurrent users instead of 20.

Using 4 CPU cores (4x baseline)

4xCPU

Adding more CPU cores doesn’t seem to be my highest priority.


Next step, mixing and matching.

You’ve probably already figured out that 128 Mb RAM is too little memory to host a stock WordPress application. We’ve discussed WordPress specifically before and this is not the first time we realize that WordPress is hungry for RAM. But the point of this article wasn’t about that. Rather, I wanted to demonstrate a structured approach to resource planning.

In a more realistic scenario, you’d be looking for a balance between RAM, CPU and other resources. Rather than relying on various ‘rules of thumb’ of varying quality, performing the actual measurements is a practical way forward. Using a modern VPS host that let’s you mix and match resources, it’s quite easy to perform these tests. So the next step is your’s.

My next step will be to throw faster disks (SSD) into the mix. Both Apache/PHP and MySQL benefits greatly from running on SSD disks, so I’m looking forward to seeing those numbers.

Comments, questions or criticism? Let us know by posting a comment below:

——-

0b59bcbThis article was written by Erik Torsner. Erik is based in Stockholm, Sweden, and shares his time between being a technical writer and customer projects manager within system development in his own company. Erik co-founded mobile startup EHAND in the early 2000-nds and later moved on to work as technology advisor and partner at the investment company that seeded Load Impact. Since 2010, Erik manages Torgesta Technology. Read more about Erik on his blog at http://erik.torgesta.com or on Twitter @eriktorsner.


About Load Impact

Load Impact is the leading cloud-based load testing software trusted by over 123,000 website, mobile app and API developers worldwide.

Companies like JWT, NASDAQ, The European Space Agency and ServiceNow have used Load Impact to detect, predict, and analyze performance problems.
 
Load Impact requires no download or installation, is completely free to try, and users can start a test with just one click.
 
Test your website, app or API at loadimpact.com

Enter your email address to follow this blog and receive notifications of new posts by email.