Performance & Scalability Test: Pantheon -VS- Other Drupal-Based Platforms

In this post I will demonstrate how to  setup a Drupal 7 site from scratch using Pantheon. Then, using Load Impact, I will attempt to compare the performance of Pantheon versus other Drupal-based platforms (Aberdeen Cloud platform and VPS).

Pantheon

For those who don’t know Pantheon, it’s a cloud platform for web development using different frameworks such as Drupal or WordPress. It provides development, testing and live environments for easy deployment using git. And since it’s built using containers instead of virtual machines, it’s performance and scalability is considerably better than traditional hosting providers.

Pantheon-howItWorks copy

Pantheon also provides a platform with preconfigured tools such as Varnish, Redis, Apache Solr, automated backups and application updates, etc.

For this performance test, we are going to need to create a Pantheon user account.

As a registered Pantheon user, we now see the Pantheon control panel:

1-your-sites

Now we need to create a site in order to install Drupal and run a performance test.

Steps to creating a Drupal 7 site using Pantheon

1. After registering an account with Pantheon, click “Create a site now” link.

2-account-ready

2. Next, provide some information about the site, such as the name and the access URL. Later, you can easily redirect your existing domain if you need it.

Press the “Create Site” button to continue with the process.

3-create-site


3. Create or import a site

You can create a site from scratch using one of the available web application cores for Drupal or WordPress, or you can import an existing one – packing your application files and database dump.

For this test, we are going to start a Drupal 7 site from scratch, but feel free to import your existing application if you want to compare its performance in Pantheon.

Select “Start from scratch” option and one of the available cores – in this case Drupal 7.

Press “Install Drupal 7” button to continue with the site installation.

Pantheon will setup the site with the best suitable configuration for Drupal 7.

6-create-drupal-site


4. Use the dashboard and configure your application

Once the site is completely installed you will have access to the site Dashboard where you can configure different aspects of your application, create backups and use the Pantheon tools.

10-dashboard

Now it’s time to install Drupal. As you can see, the site installer only copied Drupal 7 files but it didn’t execute Drupal installation.

You have to do it manually, so just press “Visit Development Site” button.

11-visit-development-site

5. Install Drupal

In this case, you are going to install Drupal 7 using a Pantheon profile – a custom Drupal distribution preconfigured with Pantheon modules and custom configuration that enables Drupal caching and provides better performance, and an Apache Solr integration.

Press “Save and continue” button to go to next installation step where you can select default language for Drupal. You can install Drupal 7 in other languages – but that can be done later.

Press “Save and continue” button again and Drupal will install with pre-selected Pantheon configuration.

After the installation you have to configure site details, such as site name or administrator username, password and email.

Once you’ve completed the form details, Drupal should be installed and ready to use.

12-drupal-choose-profile


6. Start using Drupal

To start using Drupal just press “Visit your new site” link and you will access your brand new Drupal 7 website.

7.  Setup your git repository in your local machine

Now it’s time to set up your git repository in your local machine so you can add or modify your Drupal website.

First of all, you need to add your SSH public key into your Pantheon user account. Just go to “Sites & Account” in your user menu.

18-sites-account

If you don’t already have a SSH key you have to create it. You can find more information about SSH key generation here: http://helpdesk.getpantheon.com/customer/portal/articles/366938-generate-ssh-keys

Once you have created your SSH key, you should add your Public Key just by pressing the “Add key” button. For more information about SSH keys, visit this page: http://helpdesk.getpantheon.com/customer/portal/articles/361246-loading-ssh-keys

Now you can connect to Pantheon git repository using SSH.

8. Configure the repository in your local machine

To configure the repository in your local machine you should have git previously configured. If you need to install git just follow this guide for all platforms https://help.github.com/articles/set-up-git

First you should copy the path to connect to your server using SSH, because you are going to need it later. You can find it in your project dashboard.

20-dashboard

We are going to use Git as connection mode so be sure that it’s selected and copy the URL you find in the textbox. As you can see in the following screenshot:

21-connection-mode

Go to your terminal and execute the following command from the location where you want to create your project repository folder (Don’t forget to use the URL you previously copied):

$ git clone ssh://codeserver.dev.xxx@codeserver.dev.xxx.drush.in:2222/~/repository.git drupal-loadimpact

If everything goes well, the command will create a folder named drupal-loadimpact with all the files corresponding to Drupal 7 core.

9. Install devel module

Now we are going to install devel module. This Drupal module will help us to creat thousands of nodes in our Drupal website.

A node is a Drupal piece of content with multiple fields and properties, and we are going to use them for our performance test.

You can download the module using wget or drush, but remember to place the module files into sites/all/modules directory in your repository folder.

Then add the new files for commit using the following command:

$ git add sites/all/modules/devel

Commit the changes into your local repository using a descriptive message:

$ git commit -m"Added devel module."

And finally push the changes to the remote repository:

$ git push origin master

You can check that everything went well by checking the commit log in your project dashboard.

22-devel-module-commit

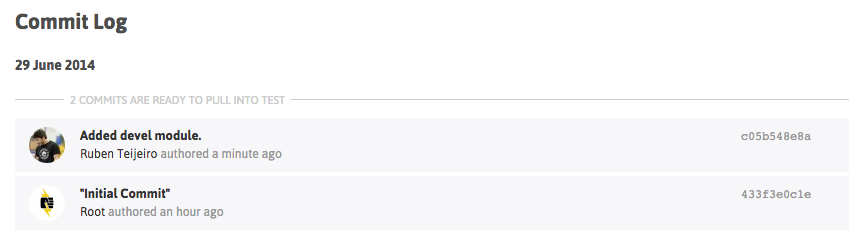
You can see the new commit with your descriptive message.

10.  Install devel module by enabling it in Drupal

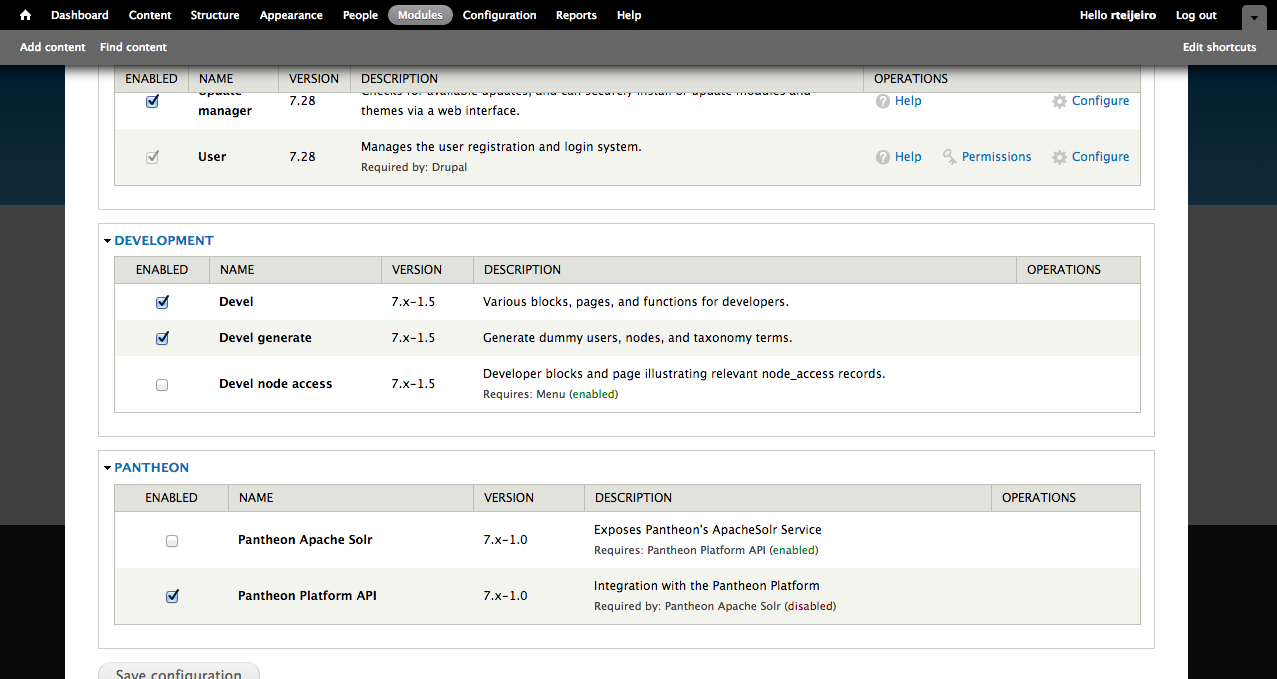
Select “Modules” menu option from the top menu in your Drupal site.

Enable only Devel and Devel generate modules.

23-drupal-modules


11. Generate content 

Now select “Configuration” menu option from the top menu. And then select “Generate content” option.

25-devel-menu


In this example, we are going to create 5000 nodes of type Article for our performance test. It should be enough to have a high amount of content in the Drupal database and create different performance tests.

27-devel-generate-content

Press “Generate” button and relax because it’s going to take a while. You can take a cup of coffee 😉

…. (coffee break)

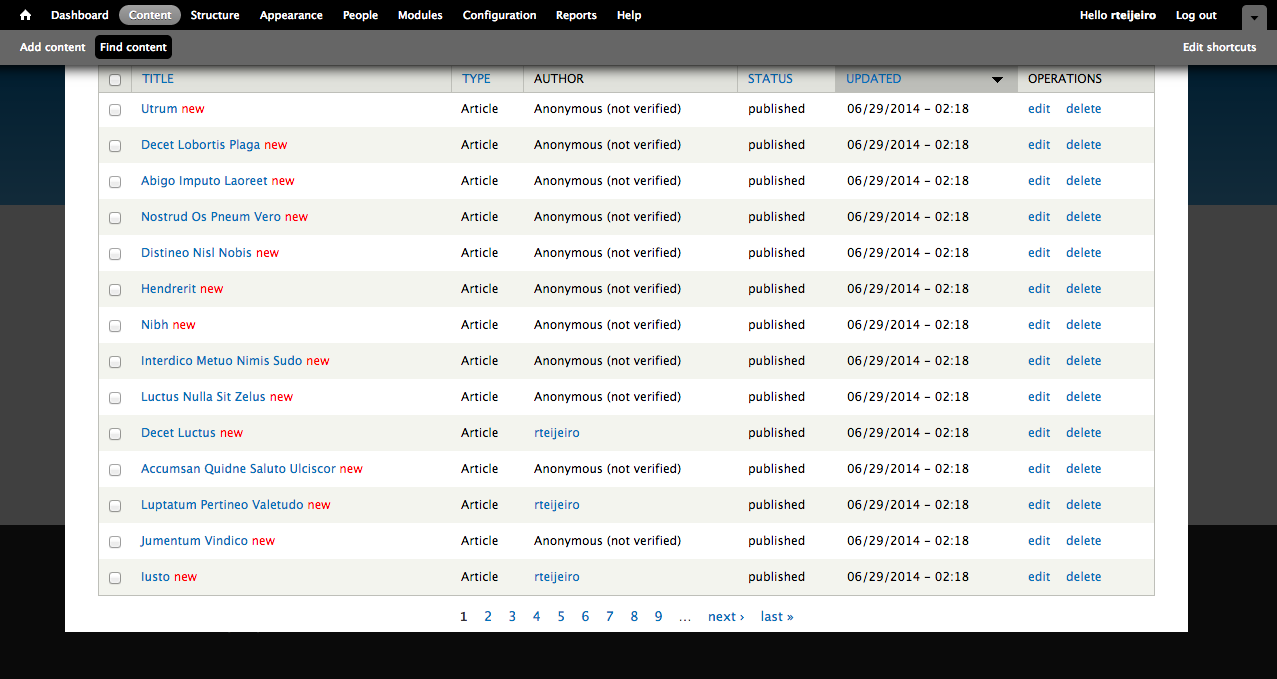
So, here you have your 5000 recently created articles. To see them just select “Content” from the top menu.

29-drupal-content

12. Create page listing all content (for performance testing purposes)

Now we are going to create a page that will list all the content so it will create a high amount of database queries and render a lot information in the page.

For that we will need Views (https://www.drupal.org/project/views) and Chaos Tools Suite (https://www.drupal.org/project/ctools) modules.

You can download them using the same method you used to download Devel module. Don’t forget to place them in sites/all/modules folder to let Drupal to find them and be able to install them.

Once you have downloaded the modules into your local repository, you can add and commit the modules into your local repository as we did before:

$ git add sites/all/modules/views
$ git commit -m”Added views module.”
$ git add sites/all/modules/ctools
$ git commit -m"Added ctools module."

Now push the changes to your remote repository:

$ git push origin master

Once again, you can see your commits in the Commit Log in your project dashboard and verify that everything went well.

To enable the modules, select “Modules” option in your top menu:

Enable Chaos tools module because it’s a dependency of Views module:

32-chaos-tools

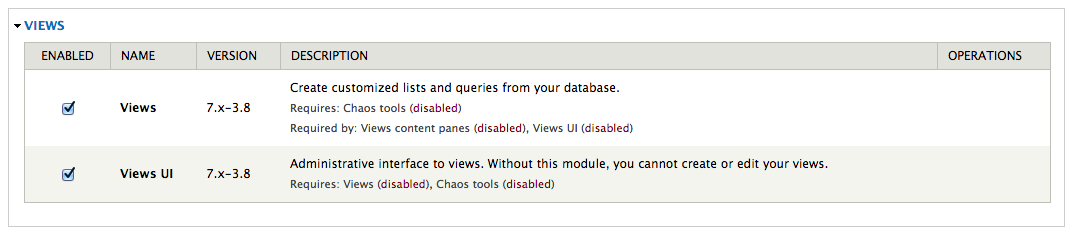
Also enable Views and Views UI modules:

33-views-module-enable

Now select “Structure” option form the top menu to start creating your view page.

Then select “Views” option.

On this page you can find a list of preconfigured views. We are going to create our own view page with a list of a specific number of content articles.

35-views-list


13. Create and configure a new View

Select “Add new view” link to start.

Create a new view using the following configuration and press “Continue & edit” button.

37-views-create

This page is the configuration panel for your view. You can add fields, sorting order and filters as well as arguments and other custom features.

38-views-add-fields

We are going to add a few fields to display more content in the page.

Now you can see that there is only Title field available. Press the “Add” button in “Fields” section.

In the next window select Body and Image fields and press “Apply (all displays)” button with default settings for all fields.

40-views-select-fields

Now your “Fields” section should contain the following:

  • Content: Title
  • Content: Body(body)
  • Content: Image(image)

Press “Save” button to save your new view.

14. Visit your new page

Now you should be able to visit your page. The page we created for testing is here: http://dev-drupal-loadimpact.gotpantheon.com/performance-test

You should see a page with 100 article nodes –  which is a normal amount of data for Drupal to load.

It will create a considerable number of database queries and processes to render all the content into the page.

Consider to increase or decrease the number of items in the “Pager” section of your view if you want to test with different amount of data loaded.

You can select different values to adapt the performance test to your real needs.

43-views-pager-config


We have to take into consideration the default configuration that Pantheon profile applies to Drupal.

If you select “Configuration” in the top menu you can find “Performance” menu item:

44-performance-link

In this page you can find configuration settings related to Drupal performance. You can see that there are a few settings already enabled.

Page and block caches are enabled for 15 minutes. Also, CSS and JavaScript are aggregation is enable – what packs all CSS and JavaScript files and build them together in order to decrease the number of requests to the server to download all the files.

45-performance

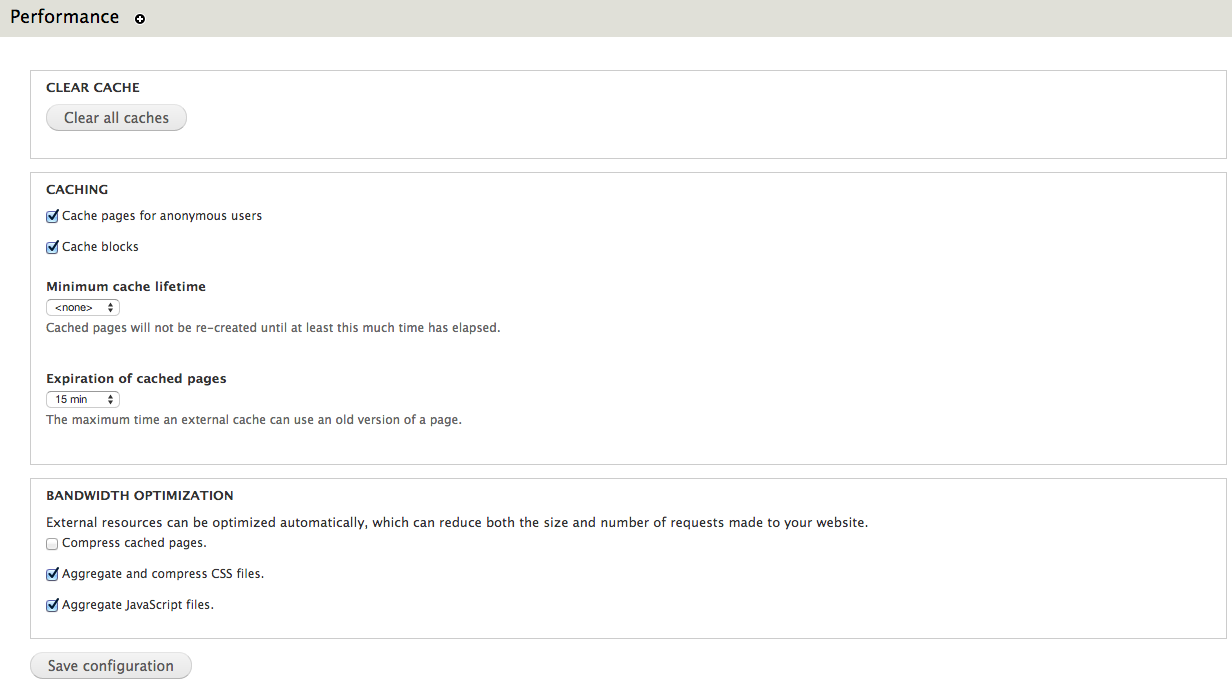
It’s important to clear caches every time you run a new performance test to be sure that you don’t have cached pages. Just press “Clear all caches” button.

Testing the performance of Drupal-based platforms

Now it’s time for performance testing using Load Impact. Create a user account if you don’t already have one.

After that visit “My tests” to start creating your performance test and press “Start a new test” button. This will execute a rather small test of 50 concurrent users for 5 minutes.

47-my-tests

Type your test page URL into the text box and press “Start test” button.

You can also configure a larger test from the “Test configurations” page (e.g. with ramp-up/down; additional IPs, multi-geo load generation; mobile network emulation, server metrics, etc.)

48-start-test

The test will start and you will see how Load Impact is creating requests from different hosts.

50-test-running


Pantheon results

The following are the performance test results for the same Drupal site (using the same configuration and number of content nodes) hosted in Pantheon and Aberdeen Cloud platforms and a Virtual Private Server:

51-pantheon-test

Pantheon results (user load time)

Aberdeen Cloud 

52-aberdeencloud-test

Aberdeen Cloud results (user load time)

VPS (CPU: 1.5 Ghz. – RAM: 1 Gb.)

53-VPS-test

VPS results (user load time)


You can observe that Pantheon keeps user load time between 1.5 and 3 seconds, meanwhile with Aberdeen Cloud platform and the VPS, the user load time stays between 3 and 4 seconds.

Based solely on these few simple load tests, it seems Pantheon manages to serve Drupal pages at least one second faster than the other tested platforms. 

Now it’s time for you to try different configurations for the Drupal site, like number of content nodes, disable caching or file aggregation and see how it affects performance and scalability.

Read more about load and performance testing with Pantheon: http://helpdesk.getpantheon.com/customer/portal/articles/690128-load-and-performance-testing

——–

This blog post was written by Ruben Teijero. Follow the Load Impact blog (see below) for more great articles by Ruben and many other fantastic developers, testers and operations pros.

5 Lessons Learned After Self-Hosting Goes Haywire

When things start to go wrong it can sometimes be impossible to contain the unravelling – as if the problematic situation quickly gains momentum and begins to ‘snowball’ into an even worse situation.

This happened to me recently. And since much of what went wrong could have been prevented with good process controls, I believe I have some valuable lessons to share with you.

At the very least this post will be entertaining, as I assume many of you reading this will think to yourself: “yep, been there done that”.

I’ll start by mentioning how I met the folks at Load Impact and started working with their product and writing for them.

I was doing some shopping for a hosting provider for my personal and business website, and ran across someone else’s blog post that tested the performance of all the major players in the ‘affordable web hosting’ segment.  We are talking the $8/month type deals here – the bare bones.

This author used Load Impact to quantify the performance of all these providers and provided great insight into how they faired from a performance and scalability perspective.

My first thought was: awesome! – I’ll use that same tool and test a few out myself, and then compare it to the performance of a self-hosted site.  I already had a bunch of VMs running on an ESXI server so adding a turnkey wordpress site would be super easy.

It turns out that my self hosted site was much faster and scaled all I needed (thanks to Load Impact), so in the end I decided to just self host.

I’m not making any money from the sites – no ecommerce or ads – so it doesn’t really matter from a business perspective.It’s also easier to manage backups and control security when you manage the whole environment.

But it’s also much more likely that the whole thing will get screwed up in a major time-consuming way.

I imagine there are many SMBs out there that self host as well, for a variety of reasons.  It could be that you like having control of your company assets, it was faster and cheaper, or you just like doing everything yourself.

It’s often very difficult for smart people to avoid doing things they can do but probably shouldn’t do as it might not be the best use of their time.

In this blog post I’ll demonstrate how how quickly this situation can go wrong and then go from bad to worse:

Problem #1: my ISP screwed me!

If you are in business long enough, your ISP will screw you too.  I made a change to my service plan (added phone line) which I did the week before we went out of town.

For some reason nothing happened so I decided called my provider while 300 miles away from my house. Of course, this is exactly when things started to unravel.

Instead of provisioning my modem correctly, they removed my internet service and added phone.  No internet.  To make matter worse,  I’m not at home so I can’t troubleshoot.

Lesson #1 – don’t make changes with your ISP unless you can be onsite quickly to troubleshoot.

It was nearly impossible for me to troubleshoot this issue as I couldn’t VPN into my network, there wasn’t a connection at all.

I even had a neighbor come in and manually reboot both my firewall and modem.  That didn’t work, so my only recourse was a dreaded call to customer support.

The first time I called it was a total waste of time, the Customer Support agent had no idea what was going on so that call ended.

Call number two the next day was slightly more productive in that it ended 45 minutes later and a level 2 support ticket was opened.

Finally, upon getting a level 2 engineer on the line (I was home at this point), they immediately recognized that my modem was mis-provisioned and was setup for phone only!  It only took minutes to properly provision the modem and get it back online.

Lesson #2 – if you are technically savvy, then immediately demand a level 2 support engineer. Time spent with first line support is usually a totally frustrating time suck.

giphy

Problem #2: Some things start working again and others mysteriously don’t 

After the final problem-resolving phone call was complete I was tired, hot (AC was off while out of town) and irritated. So when the internet connection finally came back up, I wasn’t exactly in a “I’m making great decisions” mindset.

So I go to check my site and one works fine, but this one it not up at all.  I reboot the VM but still no response from the server.

I’m not sure what is going on.

Lesson #3 – Don’t start making significant changes to things when tired, hot and irritated.  It won’t go well.

This is exactly the point at which I should have made a copy of the VM in it’s current state to make sure I don’t make things worse.  But instead I immediately go to my backup server (Veeam) and try to restore the VM in question.

Well guess what?  That didn’t work either, some sort of problem with the storage repository for Veeam.  Unfortunately, the problem is that some of the backup data is corrupt.

I ended up with a partially restored but completely unusable webserver VM.

giphy-2

Lesson #4 – Test your backups regularly and make sure you have more than one copy of mission critical backups.  

At some point in this whole fiasco, I remembered what this package I had on my desk was.  It was a replacement hard drive for my ZFS array because one of my 4 drives in the RAIDZ1 array was “failing”.

I figured that now would be the perfect time to swap that drive out and allow the array to heal itself.

Under normal circumstances this is a trivial operation, no big deal.  Not this time!

This time, instead of replacing the failing hard drive, I accidentally replace a perfectly good drive!

So now I have a really tenuous situation with a degraded array that includes a failing hard drive and no redundancy whatsoever.

Fortunately there wasn’t any real data loss and eventually I was able to restore the VM from a good backup source.

Finally back online!

Lesson #5 – Be extra diligent when working on your storage systems and refer to Lesson #3.

The overall message here is most, if not all, of these issues could have been easily avoided. But that is the case 99% of the time in IT – people make mistakes, there is a lack of good well documented processes to handle outages, and of course hardware will fail.

It’s also worth noting that in large enterprises mechanisms for change control are usually in place – preventing staff from really messing things up or making changes during business hours.

Unfortunately, many of smaller businesses don’t have those constraints.

So what does this have to do with Load Impact?  Nothing directly…but I think it’s important for people to be aware of the impact that load and performance testing can have on the infrastructure that runs your business and plan accordingly when executing test plans.

Just like you wouldn’t do something stupid like changing network configs, ISP settings or Storage without thoroughly thinking it through, you should also not unleash a world-wide load test with 10,000 concurrent users without thinking about when you should execute the test (hint – schedule it) and what the impact will be on the production systems.

Hopefully there is a test/dev or pre-production environment where testing can take place continuously, but don’t forget many times there are shared resources like firewalls and routers that may still be affected even if the web/app tiers may not be.

And always remember Murphy’s lawAnything that can go wrong will go wrong. 

———-

Peter CannellThis post was written by Peter Cannell. Peter has been a sales and engineering professional in the IT industry for over 15 years. His experience spans multiple disciplines including Networking, Security, Virtualization and Applications. He enjoys writing about technology and offering a practical perspective to new technologies and how they can be deployed. Follow Peter on his blog or connect with him on Linkedin.

Don’t miss Peter’s next post, subscribe to the Load Impact blog by clicking the “follow” button below. 

New Pay-Per-Test Credits ($1 = 1 Credit)

We recently made two big changes to our pricing.

1. We released monthly subscriptions

2. We converted our test credits to a $1=1 credit model.

If you already had credits in your account before this change, you will notice that the total amount of credits in your account has increased.

Don’t worry, we aren’t a failed state. Your new credit count buys you just as much load testing as you could do before.

We simply wanted to simplify the process of purchasing a single test. Now you can get an exact dollar price for the test you want to run. Easy-peasy-lemon-squeezy!

The price for a single test is based on two factors – load level and test duration.

Head of over to our pricing page to see how it works.

Pay-per-test sliders

HealthCare.gov tech taskforce is invited to use our load testing services free of charge

We’re offering to provide the technology taskforce responsible for fixing the troubled HealthCare.gov website free use of our performance testing services until the Obamacare website is functioning at full capacity.

Healthcare .gov

In testimony before the House Energy and Commerce Committee on Thursday, officials of companies hired to create the HealthCare.gov website cited a lack of testing on the full system and last-minute changes by the federal agency overseeing the online enrollment system as the primary cause of problems plaguing the government exchange for President Barack Obama’s signature health care reforms.

Moreover, according to a confidential report obtained by CNN, the testing timeframes for the site were “not adequate to complete full functional, system, and integration testing activities” and described the impact of the problems as “significant.” The report stated there was “not enough time in schedule to conduct adequate performance testing” and was given the highest priority.

We know that there’s really nothing new in the failure of the Obamacare site. Websites have been developed that way for years – often with the same results. But there are now new methodologies and tools changing all that. That’s why  we’ve reached out to our California representatives and all of the companies involved to let them know we’re ready to provide our stress testing services to them free of charge.

It isn’t like it used to be – this shouldn’t be hard, time consuming or expensive. You just need to recognize that load testing is something that needs to be done early and continuously throughout  the development process. It’s not optional anymore. Unfortunately, it seems they found that out the hard way. But we sincerely want to help make it work.

HealthCare.gov represents hope for many Americans, and the elimination of their worst fears in medical care. Instead of whining about how incompetently HealthCare.gov has been built, we want to be part of making it work as it should and can.

Write Scalable Code – use Jenkins to Automate your Load Testing

Starting today, we’re  accepting applications for early access to our new Load Impact Continuous Delivery service, which for the first time allows developers of websites, apps and APIs to make stress testing an integrated part of their continuous delivery process.

Our Continuous Delivery service comprises our API, SDKs and a library of plug-ins and integrations for popular continuous delivery systems – starting with Jenkins.

Easy to USe and Flexible Graph png

In order to better serve our customers and allow them to integrate their Continuous Delivery methodology with the Load Impact platform, we’re building programming libraries that make the API super easy to use. We’re starting with Jenkins and will soon rollout plug-ins for TeamCity, New Relic and CloudBees.

Simply put, the Jenkins plug-in will integrate load testing into developers’ automated Jenkins test suite to determine whether new builds meet specified traffic performance criteria.

(Download the plug-in)

The new Jenkins plug-in features multi-source load testing from up to 12 geographically distributed locations worldwide, advanced scripting, a GUI based session recorder to easily create tests simulating multiple typical user scenarios, and our new Server Metrics Agent (SMA) for correlating the Server Side impact of users on CPU, memory, disk space and network usage.

Read more about how to automate your load testing here and here.

Apply now to join our private beta group and receive FREE unlimited load testing for the duration of the beta period!

Different types of website performance testing – Part 3: Spike Testing

This is the third of a series of posts describing the different types of web performance testing. In the first post, we gave an overview of what load testing is about and the different types of load tests available. Our second post gave an introduction to load testing in general, and described what a basic ramp-up schedule would look like.

We now we move on to spike testing. Spike testing is another form of stress testing that helps to determine how a system performs under a rapid increase of workload. This form of load testing helps to see if a system responds well and maintains stability during bursts of concurrent user activity over varying periods of time. This should also help to verify that an application is able to recover between periods of sudden peak activity.

So when should you run a spike test?

The following are some typical example case scenarios where we see users running a spike test, and how your load schedule should be configured in Load Impact to emulate the load.

Advertising campaigns

Advertising campaigns are one of the most common reasons why people run load tests. Why? Well, take a lesson from Coca Cola – With an ad spend of US$3.5 million for a 30 second Superbowl commercial slot (not including customer cost), it probably wasn’t the best impression to leave for customers who flooded to their Facebook app.. and possibly right into Pepsi’s arms. If you’re expecting customers to flood in during the ad campaign, ramping up in 1-3 minutes is probably a good idea. Be sure to hold the load time for at least twice the amount of time it takes users to run through the entire scenario so you get accurate and stable data in the process.

Contests

Some contests require quick response times as part of the challenge issued to users. The problem with this is that you might end up with what is almost akin to a DDOS attack every few minutes. A load schedule comprising of a number of sudden spikes would help to simulate such a situation.

TV screenings/Website launches

If you’re doing a live stream of a very popular TV show (think X Factor), you might want to consider getting a load test done prior to the event. Slow streaming times or a website crash is the fastest way to drive your customers to the next streaming app/online retailer available. Take Click Frenzy as an example – they’re still working to recover their reputation. Streaming servers also tend to be subject to prolonged stress when many users all flock to watch an event or show, so we recommend doing a relatively quick ramp up and ending with a long holding time.

Ticket sales

Remember the 2012 London Olympics? Thousands of frustrated sports fans failed to get tickets to the events they wanted. Not only was it a waste of time for customers, but it also served to be a logistics nightmare for event organizers. Bearing in mind that a number of users would be ‘camping’ out on the website awaiting ticket launch, try doing a two stage quick ramp up followed by a long holding time to simulate this traffic.

TechCrunched… literally!

If you are trying to get yourself featured on TechCrunch (or any similar website that potentially might generate a lot of readership), it’s probably a good idea to load test your site to make sure it can handle the amount of traffic. It wouldn’t do to get so much publicity and then have half of them go away with a bad taste in their mouth! In these cases, traffic tends to come in slightly slower and in more even bouts over longer periods of time. A load schedule like this would probably work better:


Secondary Testing

If your test fails at any one point of time during the initial spike test, one of the things you might want to consider doing is a step test. This would help you to isolate where the breaking points are, which would in turn allow you to identify bottlenecks. This is especially useful after a spike test, which could ramp up too quickly and give you an inaccurate picture of when your test starts to fail.


That being said, not all servers are built to handle huge spikes in activity. Failing to handle a spike test does not mean that these same servers cannot handle that amount of load. Some applications are only required to handle large constant streams of load, and are not expected to face sharp spikes of user activity. It is for this reason that Load Impact automatically increases ramp-up times with user load. These are suggested ramp up timings, but you can of course adjust them to better suit your use case scenario.

Code sample for automated load testing

In the previous post about automated load testing, we didn’t have the room to include a proper sample. So that’s what this post is going to be about. The complete code sample can be found here https://github.com/loadimpact/loadimpactapi-samples

A few comments if you want to try it out:

At the beginning, we net to set token and test id. If you haven’t already done so, you can generate an API token on your accounts page https://loadimpact.com/account/. Please note that the API token is not the same as the server metrics token. The next thing is to find the test configuration id that you want to run.

test_config_buttonAssuming that you already have an account and at least one test configuration created, you just go to your test configuration list and click on the test you’re interested in running. The URL will say https://loadimpact.com/test/config/edit/NNNNN where NNNNN is your test id. At the top of the test script, you find the two variables that you need to update. $token and $test_config_id.


$token = 'aaaaaaaaaaaaaaaaaaaaaaaaaaaaaaaaaaaaaaaaaaaaa';
$test_config_id = 1234567;
$verbose = TRUE;

Then, the interesting part of the script is quite straightforward:

$resp = loadimpactapi("test-configs/$test_config_id/start", 'POST');
if(isset($resp->id)) {
 $test_id = $resp->id; // The Id of the running test.
 $running = TRUE;
 $status = loadimpactapi("tests/$test_id", 'GET');
while($running) {
 if($verbose) echo "Test $test_id is {$status->status_text} \n";
 if($status->status > 2) { 
 $running = FALSE; 
 break;
 }
 sleep(15);
 $status = loadimpactapi("tests/$test_id", 'GET');
 }
// At this point, a status code != 3 would indicate a failure
 if($status->status == 3) {
 $jsonresult = loadimpactapi("tests/$test_id/results", 'GET');
 $timestamps = resulttoarray($jsonresult);
 echo responsetimeatmaxclients($timestamps) ."\n";
 }
} else {
 echo "Test $test_config_id failed to start \n";
}

Start the test, wait for it to finish and do something with the results. It’s really only the last part, ‘do something’ that’s deserves commenting on.

The LoadImpact API will return it’s data as two time series by default (you can ask for other time series as well). Basically, each of these two are a series of observations made during the test at given time intervals. The first series is the number of active clients seen at any given time. The other series represents the average response time from the test target. The two time series are synchronized via the timestamps (UNIX epoch). The code on github includes a function that massages these two time series into a single array of timestamps. At each timestamp, we can see number of active clients as well as the response time. So in the sample, I first run resulttoarray($jsonresult); so that I get an array that is easier to work with. Then I call responsetimeatmaxclients($timestamps) to find the response time found at the highest load during the test.

At the and, the return value is simply echoed to StdOut. Running the script, I’d get something like:


erik@erik-laptop$ php test.php
Test 1234567 is Created
Test 1234567 is Initializing
Test 1234567 is Running
Test 1234567 is Finished
3747.78

Since I’ve left $verbose=TRUE, I’ll get some status messages in the output. In a real scenario where the output is likely to be handled by a script, set $verbose=FALSE so that you just get the actual measurement back to StdOut.

Questions? Ideas? Opinions? Leave a comment below, we love to hear from you.

Announcing the Load Impact API beta

We are pleased to announce the Load Impact API beta!

the developer.loadimpact.com API documentation site

For people who do not know what an API is, or what it is good for, our API allows you to do basically everything you can do when logged in at loadimpact.com, like configure a load test, run a load test, download results data from a load test. But the API can be used by another program, communicating with Load Impact over the Internet. This means that a developer can write an application that will be able to use our API functionality to configure and run load tests on the Load Impact infrastructure – and this can happen completely without human involvement, if the developer chooses it.

The API is very useful for companies with a mature development process, where they e.g. do nightly builds – and run automated tests – on their software. The API allows them to include load tests in their automated test suites, and in that way monitor the performance and scalability of their application while it is being developed. This is useful in order to get an early indication that some piece of newly produced code doesn’t perform well under load/stress. The earlier such problems are detected, the less risk of developers wasting time working on code tracks that don’t meet the performance criteria set up for the application.

The API can also be used by other online services or applications, that want to include load testing functionality as part of the service/product, but where it is preferable to avoid building from scratch a complete load testing solution like Load Impact. They can use our API to integrate load testing functionality as part of their own product, with Load Impact providing that functionality for them.

We have created a whole new documentation section for the API at http://developer.loadimpact.com where you can find the API reference and some code examples. We will be delighted to hear from you if you are using the API, so don’t hesitate to get in touch with us! Feedback or questions are very welcome!


2.0 Highlights

Load Impact 2.0 was released at the end of October (27th). The first few days after release were pretty chaotic, with lots of minor issues and some major ones, but having been involved in many big releases during my career I have to say that this one went pretty well actually. The system was up and functional most of the time, the first few days post-release, and that isn’t bad at all 🙂

Still, there were some difficulties, of course. We had problems first with AMEX payments due to contractual reasons (AMEX payments have been removed for now, until we manage to get through the AMEX bureaucracy) and then with VISA/MC payments. Then there was occasional problems with internal queueing systems that caused some load tests to either fail, “freeze” (get stuck in some state), or never get started. All these issues should have been resolved by now, but there are likely smaller things that will pop up from time to time, so we urge everyone to get in touch with us if you see anything strange happening on the site. Don’t hesitate to get in touch with us even if you’re unsure whether something is a problem on our side or not, we want to know about all situations where someone has any kind of problem using our service. No issue is too small.

In general, the system is starting to get very stable now, however, and we see more activity than before the release, with more user registrations and more tests being executed. We also see more advanced usage of our service – more people are writing advanced load scripts and running both larger and more complex load tests than ever before. It is all very encouraging and tells us that we are moving in the right direction!

So what is so great about 2.0 then?

Some people may see Load Impact 2.0 as simply an upgrade, but it’s more like the launch of a whole new service. It is that much different from 1.0. We have kept some 1.0 key elements that we (and hopefully everyone else) liked such as the ability to run small, simple tests anonymously from our front page, the ability to watch other such anonymous tests that are being run, and the scripting language and scripting API, but behind the scenes most of the code base is new and 2.0 includes a lot of new functionality that didn’t exist in 1.0. Here is a small list:

  • Large-scale load tests
    As we are now using public cloud infrastructure (Amazon) to generate load test traffic, we have the ability to scale up a load test to a very large size at any of the geographic locations where there are cloud servers available (currently California, Oregon and Virginia in the US, plus Ireland, Japan and Singapore outside the US).
  • Multiple user scenarios in a single test
    In 2.0 we introduce “user scenarios”. A user scenario defines a certain simulated user category and what that category should be doing on your site. An example can be an e-shopping site that has two types of visitors – one type that just browses the site without buying anything, and another type that registers a user account on the site and then goes on to actually buy products on the site. In Load Impact 1.0 you could not easily combine these two different user categories in a single load test, but with Load Impact 2.0 it is easy – you just create two different user scenarios, that run different load scripts, then you configure your load test to use these two scenarios.
  • Multiple geographical traffic sources
    With Load Impact 2.0 you can now choose to have your traffic originate from more than one physical place, if you want. You can specify any number of combinations of user scenarios (described above) and geographical locations where that particular user scenario should be executed, and create very complex load test configurations where you define that e.g. 10% of the total number of simulated users during the load test should run user scenario X from geographical location Y.
  • More performance metrics
    We now collect more performance metrics than in 1.0, such as “requests per second”, and we collect many more sampling points that are all time-based rather than client level-based. This results in more performance data available at higher resolutions than before.
  • Much more advanced chart/graph capabilities
    We provide a very dynamic test report page where you can create your own charts and graphs, plotting a wide range of parameters and correlate data with a certain user scenario or test results from a certain geographical region.
  • Text-based script editor

    For expert users, a text-based scripting editor is usually the best choice, and in Load Impact 2.0 we provide the option to choose between our graphical script editor (LILE) and a text editor that allows easy copy-and-paste and faster code entry for the experienced programmer. Load script programmers now have much more choice in how they create their load scripts.
  • Continuous tests
    Load tests are now executed continuously, which means that a simulated client thread is never shut down as long as the load level is meant to increase. Old simulated clients will just continue execution, reiterating their load script again and again, while more clients are being added. The result is a smoother and more time-efficient ramp-up process than was offered in Load Impact 1.0.
  • Credit based pricing model
    Load Impact 2.0 introuces the credit based model that means there is no difference between one user and the next as regarding them being a “premium” user or not. All users are the same, they just have different amounts of credits, and the ones that have more credits can run larger and longer tests than those who have few credits. This provides several advantages – first of all it allows us to skip all the old limits on how many tests you can run per 24 hours, etc. Now, every test you run consumes credits and only the number of credits you have affects the number of tests you can run. Secondly it means we don’t have to restrict access to some functionality to premium users – everyone can do everything on the system, so it is easy to “try before you buy”. Thirdly, it makes our product much simpler in general as we only sell one single thing now – Credits – while as earlier we sold access to different premium levels for different amounts of time, making everything a lot more complex. The drawback, however, is that it can be difficult for people to understand exactly how many credits they need to do the testing they want to do. All in all, though, we think the upsides with the credit model are much bigger than the downsides.
You can watch a video introduction to Load Impact 2.0 on Youtube: http://www.youtube.com/watch?v=CkGuBONAXLE
There are many exciting new features on our road map for the end of the year, and for 2012, and we really appreciate your feedback on exactly what things you would like to see in future versions of Load Impact. If there is something you think is missing that would really make a difference to you, please tell us about it!
We will continue to work hard on making Load Impact the best load testing solution in the world. We are slowly becoming the de-facto standard for online load testing, and it’s all thanks to you, our users, so we would like to extend a big thank you for your support ever since we launched back in 2009!  So keep load testing and don’t forget to try out all our new features!
  /Ragnar & the Load Impact team

Load Impact 2.0!

We’re excited to announce Load Impact 2.0 !

Early spring 2011, we were sitting on a ton of ideas about how to improve Load Impact. We had lots of things on our TODO list for the next few major releases of the service, and were discussing what to focus on first and what our general development road map should look like for the rest of 2011.

We came to the conclusion that incremental updates, that we had been doing so far, was not the best course of action. Some of the changes we wanted to make to the service were dependent on other changes we also wanted to make, and some were hard to achieve on top of the current legacy system. Some parts of old Load Impact we had long been wanting to remake from the ground up, and we realized that this was the time to do it. To break with the old codebase and start a new one, transferring everything we liked from the old code base but not hesitating to throw out anything we did not like.

So we embarked on that long and hard, but also fun, journey. Initially, we aimed to continue updating the old platform regularly, rolling out new features and updates to the live site while developing Load Impact 2.0 in parallel. We soon realized that this was overly ambitious, however, and decided that advanced scripting and the menu-based scripting editor that we released in April would be the last major update to the old Load Impact code base.

Then we spent most of the summer and autumn frantically developing Load Impact 2.0. Since August we have been in crunch mode, working 10-hour days, 6 days a week (which is quite a lot to us lazy and decadent Europeans) and our efforts are starting to pay off now, with the 2.0 platform getting closer and closer to being release ready. At the time of writing we are running a closed beta test, and we expect that to continue for another week or two, then we will take 1-2 weeks to finish off everything, and finally release in the second half of October.

So, what’s in it for me?  How will Load Impact 2.0 affect me?

First of all, Load Impact 2.0 is a huge upgrade from the old system. We don’t want to spoil the surprise, but it will mean a big step up functionality-wise. We expect our competitors to tear their hair out when they see it, at the very least. Introducing a lot of new features often means that you also introduce complexity, but we think we have made a pretty good job of hiding complex functionality until the user asks for it. Load Impact 2.0 should be as easy to use as (or easier than) the current system.


Introducing Load Impact credits

One big change that we want to announce beforehand, however, is the new pricing model we will adopt in 2.0. So far, we have been selling subscriptions to premium users, letting them buy premium access for a certain amount of time (a day, a week or a month) but we have realized there are several drawbacks to this scheme. For example, people cannot try out all the Load Impact features until they buy a premium subscription. How do they know that they will be able to do what they want to do, if they can’t try before they buy? Also, we have to have limits in place on how many tests you can run, how much data you can transfer etc during your subscription period, otherwise we could be hard hit if someone bought e.g. premium access for a month and then ran one test after another, continuously throughout the whole month. So we set limits, and when a user runs one test too many they are told they can’t run any more tests. Many people miss these limits, and are upset when they suddenly get denied trying to start a test.

To avoid these problems, and to get a simpler premium product, we have decided to scrap the old time-based subscriptions and instead sell Load Impact Credits. The credits are used whenever you run a load test, with a small test costing less than a large test. Just by having a registered account you will automatically receive a small amount of credits for free every month. You can use these credits to run several smaller load tests, or perhaps one medium-sized test. Per month. If your needs are more frequent or you need to run larger tests, you have to buy extra credits.

We think this system is fair and that it will allow all our amateur load testing users to continue running really small-scale load tests for free, with access to all our functionality, while the professional testers will have to pay for their testing as they often need to run more large-scale tests and sometimes more frequently also.


What will happen with the old system?  Will I be able to access my old test results?

When Load Impact 2.0 is released, we will transfer all users from the old system to the new. We will then also migrate all old test results, configurations etc. The new system will be backwards compatible with the old so you will not lose any data. In fact, there are some test result metrics that we collect today, but which you are not able to see in the user interface (such as how many transactions returned error codes). These metrics will be available in 2.0, even for your old test results.

As Load Impact 2.0 will contain all the functionality (and more) of the current system, we have no plans on keeping the old system running in parallel with the new. When we release, you will not be able to logon to the old system anymore. The web address will still be the same as always – http://loadimpact.com – but the look-and-feel, and the functionality will be different.


What if I have an active subscription at the time you upgrade the site – what happens to my subscription?

Existing subscribers will be given a generous supply of credits, so they will not feel they lost anything by buying a premium account just before the upgrade.


When is the exact date of the release?

We have to get back to you on that!  When the exact date is set, we will email all our users about it.


If you have any more thoughts or questions, don’t hesitate to contact us

About Load Impact

Load Impact is the leading cloud-based load testing software trusted by over 123,000 website, mobile app and API developers worldwide.

Companies like JWT, NASDAQ, The European Space Agency and ServiceNow have used Load Impact to detect, predict, and analyze performance problems.
 
Load Impact requires no download or installation, is completely free to try, and users can start a test with just one click.
 
Test your website, app or API at loadimpact.com

Enter your email address to follow this blog and receive notifications of new posts by email.