Your application has been localized, your website is responsive, you’ve even built a mobile app – how about your performance?!
It takes more than a mobile app, responsive design and localization to stay ahead of the game, make sure your performance can also meet the demands of an increasingly mobile and global user-base.
Regardless of whether your applications are in a highly virtual, cloud based environment or a self-hosted single datacenter, realistic performance testing must take into account all the complexities that exist between applications and end users. In today’s highly mobile world, users can literally be anywhere in the world coming across connections that vary widely in quality and speed.
A successful application deployment must take into account factors that influence this Quality of Experience (QX) and integrate continuous testing that best simulates a wide variety of situations.
Not long ago, load testing was a simple and typically one-time test done to size hardware before a roll-out. Testing was nearly always done in-house and did not take into effect what the end user experience was like and how those variables could significantly affect not only user experience but server resources as well.
Gone are the days of users only using your application from a desktop, connected to their DSL at home, and located within the same national borders as your business. Depending on who you ask, by 2020 75% of commercial transactions and 50% of consumer spend will be mobile.
Already today, mobile accounts for 25% of all web usage globally – and 80% for China only. With internet penetration soaring in countries like China, Indonesia and Brazil, its no surprise that nearly all big US-based internet properties are seeing a larger portion of their traffic and users coming from abroad.
The 2014 Mary Meeker Internet Trends report revealed that 6 of the top 10 US-based internet properties that have global operations have more than 86% of their users coming from outside the US.

This shouldn’t come as a major shock to most applications teams, those who now know they must design either a mobile responsive page or a mobile app in addition to the traditional desktop browser to stay competitive, let alone make sure that a users’ experience is consistent regardless of geographic location.
So if applications teams are so focused on designing around an increasing mobile and global user base, wouldn’t it make sense to performance test in that mode as well – using geographically distributed load, simulating mobile networks, browsers and connections?
Here are a few key considerations and benefits of what a global/mobile approach will bring:
1. Browser Simulation
Users interact with applications from a wide variety of desktop and mobile browsers (or apps) today and there are very real differences in how each use case impacts scale. It’s not good enough to simply assume every browser will follow caching and compression directives the same and that TCP connections issues will be consistent across the whole user base.
Additionally you have to take into account iPhone and Android OS types and multiple browsers on each platform. Bottom line here is to use multiple user scenarios that include different browsers and platforms mixed in!
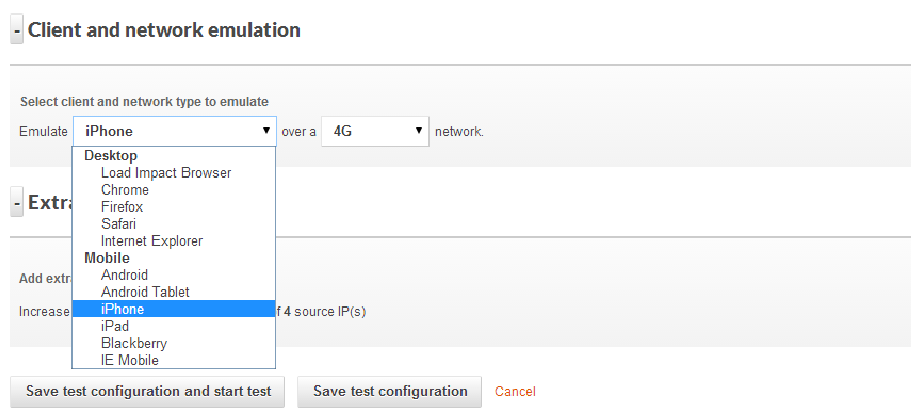
A realistic testing platform should simulate both desktop & mobile browsers
2. Network Connections
One thing that’s for sure these days is an inconsistency when it comes to how users connect to an application. Some users will have super low latency, google fiber connections (one can dream) that probably eclipse your datacenter circuit performance and others will be on a roaming 3G connection with tons of packet loss.
Even more challenging is what happens when a mobile user hands off from cellular data to WiFi and what that means to server resources (think lots of FIN & WAIT TCP states) and experience. A realistic test should include simulations for multiple connection types – DSL, 3G, LTE, unlimited, etc. Even better would be a system that can introduce jitter and packet loss to mobile connections for the ultimate in realism and impact to server resources.
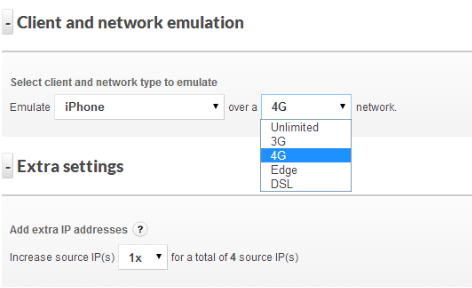
Being able to simulate different connection types and associated connection quality is also important
3. Geo-Distributed Users
Users are going to be geographically distributed for just about any application these days, even intra-net only corporate applications. And they should expect a great user experience regardless of where they are. At a bare minimum, testing within the continent where 80% of users will be located is recommended – going global is even better. Being able to test from multiple geographies simultaneously during a single test is very valuable since you can then see exactly the differences in performance and user experience with the only variable being the user location.
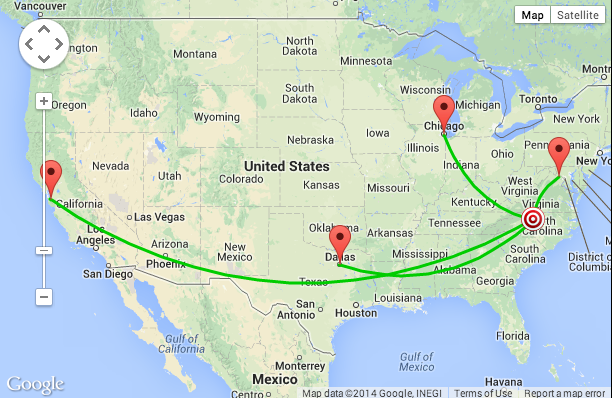
If users are primarily US based then test multiple locations within the US – at least
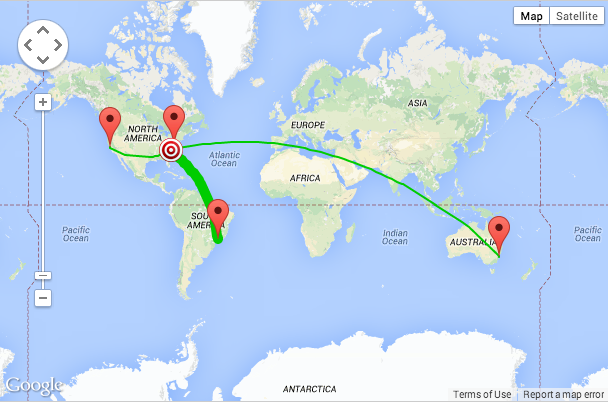
However if users (or company execs) frequently travel abroad then test it!
A great user experience (sub 1-sec load times for example) is great but if that performance drops off a cliff as you move away from the datacenter then looking into a CDN (or a better CDN) may become a high priority. If you are using distributed server resources and a complex CDN strategy, this is a great way to validate that all is working properly and you are getting the best value from the provider of choice.
The bane of most Ops teams’ existence is the “the app is slow” ticket, and the last thing a user will want to hear from a support reply is “not from here it’s not!” A great way to identify early potential performance issues on a geographic basis is to continually test (ok maybe hourly or daily) and automate that process.
If a baseline is created then when performance numbers well outside of that reference range occur you can be proactive and not reactive. If performance is slow from users in the UK but no where else and you have a quantitative analysis in hand, discussions with hosting and CDN providers takes on a much more productive tone. Think of all the unnecessarily steps and level-1 troubleshooting that can be eliminated, all potentially before the first support ticket is opened for the UK slowness that you already were working on.

Consistently slower page load times from Australia might mean it’s time for a new hosting resources or a CDN upgrade
With the tools available today, application teams have the ability to continuously test load and performance with highly realistic and sophisticated test scenarios. Performing this testing using a cloud based test platform removes on-premise test tool cost and deployment hassles and allows teams to test at every phase of a deployment including after the app goes live.
This type of approach can also help evaluate different hosting and CDN offerings well before the application goes live, and determine which providers offer the best value in the regions of the country or world you care most about. Taking a pro-active approach to monitoring the performance of applications, especially mobile applications where you are certain to face TCP connection issues, roaming from 4G to WiFI and a host of other mobile-centric challenges will go a long way to ensuring deployment success in a Dev-Ops fashion.

———–
 This post was written by Peter Cannell. Peter has been a sales and engineering professional in the IT industry for over 15 years. His experience spans multiple disciplines including Networking, Security, Virtualization and Applications. He enjoys writing about technology and offering a practical perspective to new technologies and how they can be deployed. Follow Peter on his blog or connect with him on Linkedin.
Don’t miss Peter’s next post, subscribe to the Load Impact blog by clicking the “follow” button below.


