Here at Load Impact, we’re constantly developing new features to help make our load testing tool even more powerful and easy to use. Our latest feature, Server Metrics, now makes it possible for you to measure performance metrics from your own servers and integrate these metrics with the graphs generated from your Load Impact test. This makes it much easier for you to correlate data from your servers with test result data, while helping you identify the reasons behind possible performance problems in your site. We do this by installing agents on your servers in order to grab server metrics data, which we can later insert into the results graph.
Having been a pure online SaaS testing tool, we don’t like the hassle that downloads and setups bring, so we’ve tried to make it really simple to set this up and use. (After all, we are trying to make testing more efficient, not more frustrating!)
Here’s 5 steps on how you can get Server Metrics up to a flying start:
Step 1 (Optional): Check out where Server Metrics appears in your Test Configuration
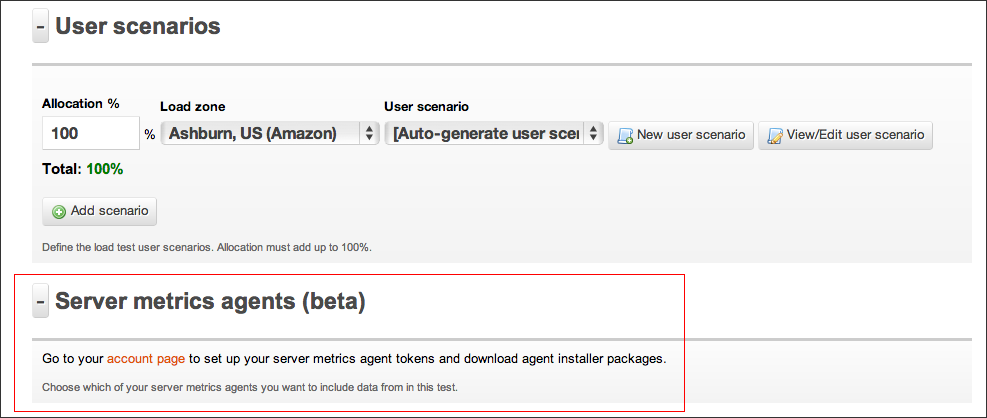
Go ahead and Log In to your account, then select the Test Configuration tab and create a new configuration. Alternatively, if you have current test configurations already set up, select one. Below the “User Scenarios” subsection, you should now find a section named “ Server Metrics”. Click on “Go to Your account page”.
Alternatively, skip this step altogether and head straight to “Access Tokens” under the “Account” tab.
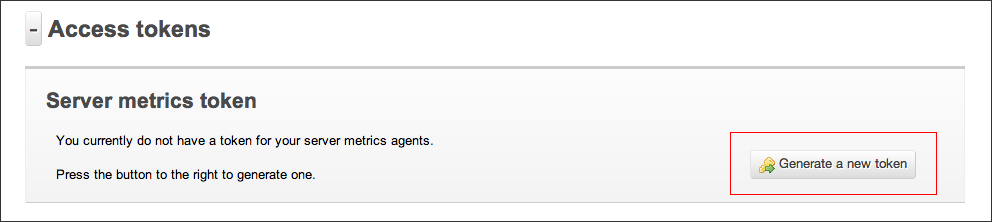
Step 2: Generating a Token
In order to identify our agents when they are talking to Load Impact, we need an identification key. We refer to this as a token. To generate a token, follow the instructions as stated.
(Yes, you only have to click on the “Generate a new token” button. Once :P)
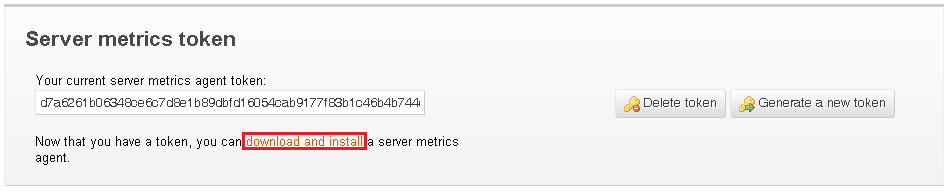
Step 3: Download and install Server Metrics agent
Now comes the hardest part. You’ll need to download and install our Server Metrics agent for your server platform. Installation should be as basic as following the instructions in our Wizard, on in the README file.
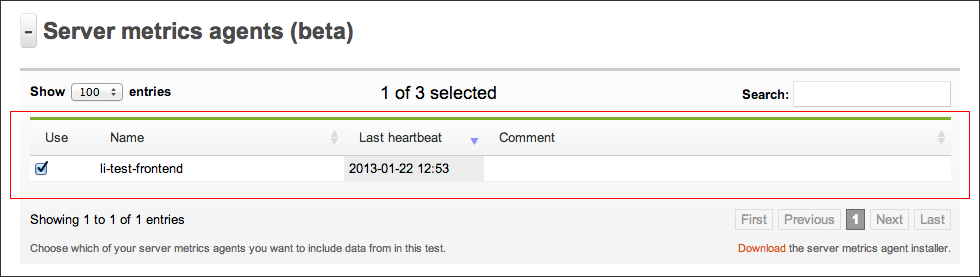
Step 4: Run your test!
Once the server metrics agent is configured, you’ll immediately be able to select it in your Test Configuration (see Step 1). We recommend giving a name that describes the name of the server you’re installing it on for easier identification later on. From here, just configure and run your test as per normal.
Step 5: Viewing Server Metrics in your test results
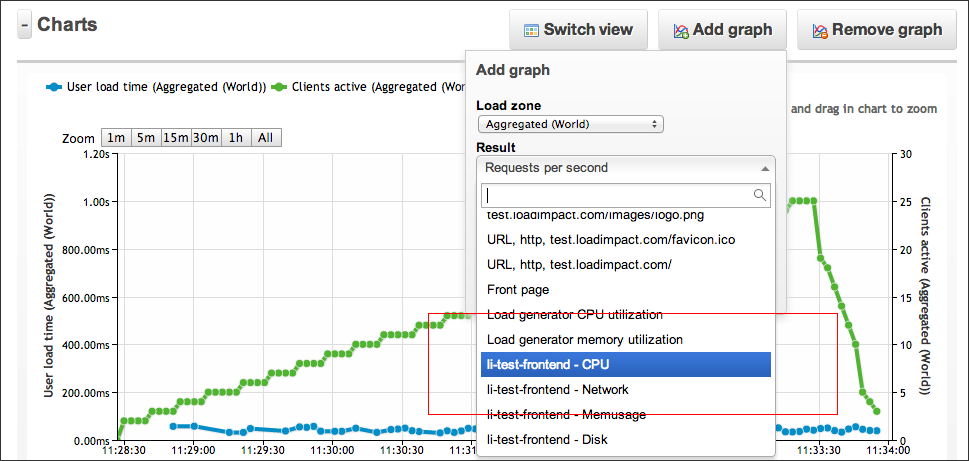
Once your test has started, you should be able to see your Server Metrics results in real time, just as with all of our other result graphs. Simply select the the kind(s) of server metrics you wish to view in the “Add Graph” drop down menu. This will plot the results for the specific server metric that you wish to view.
And that’s it! You’re all set towards easier bottleneck identification 🙂
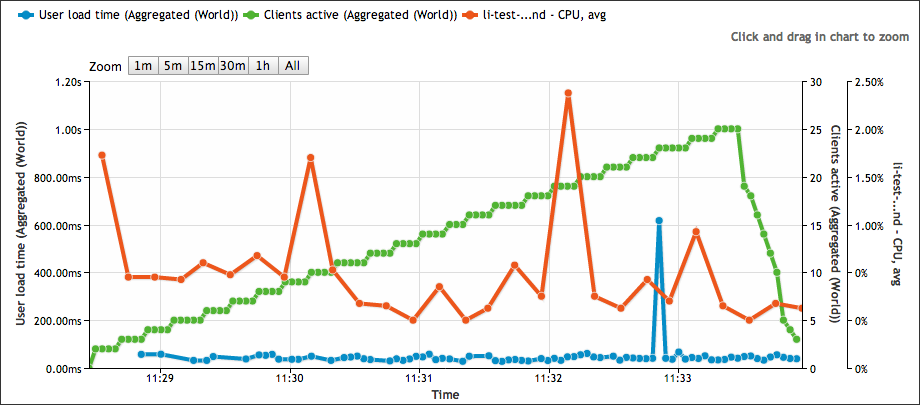
For an example of how these graphs are can help make your load testing life easier, take a look at the test results below. These results show your server’s CPU usage as load is being increased on your website.
Don’t think this is simple enough? Email support [at] loadimpact [dot] com to let us know how we can do one better!

