What to Look for in Load Test Reporting: Six Tips for Getting the Data you Need

Looking at graphs and test reports can be a befuddling and daunting task – Where should I begin? What should I be looking out for? How is this data useful or meaningful? Hence, here are some tips to steer you in the right direction when it comes to load testing result management.

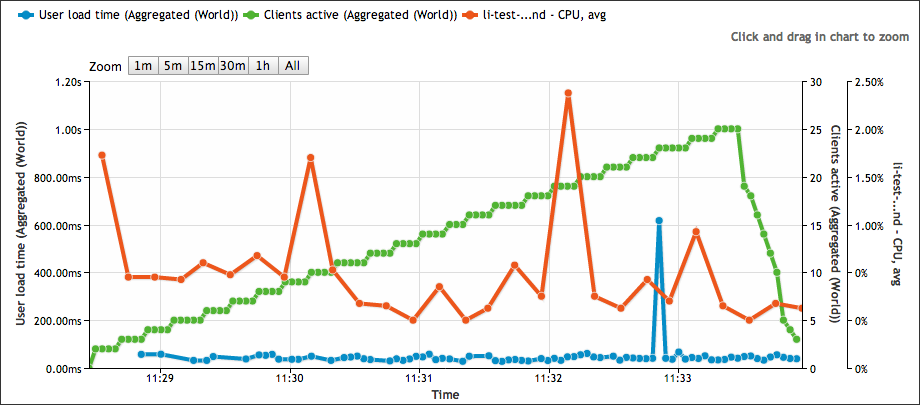
For example, the graph (above) shows how the load times (blue) increase [1] as the service reaches its maximum bandwidth (red) limit [2], and subsequently how the load time increases even more as bandwidth drops [3]. The latter phenomenon occurs due to 100% CPU usage on the app servers.

When analyzing a load test report, here are the types of data to look for:

  • What’s the user scenario design like? How much time should be allocated within the user scenario? Are they geographically spread?

  • Test configuration settings: is it ramp-up only or are there different steps in the configuration?

  • While looking at the tests results, do you get an exponential growing (x²) curve? Is it an initial downward trend that plateaus (linear/straight line) before diving downwards drastically?

  • How does the bandwidth/requests-per-second look like?

  • For custom reporting and post-test management, can you export your test results to CSV format for further data extraction and analysis?

Depending on the layout of your user scenarios, how much time should be spent within a particular user scenario for all actions (calculated by total amount of sleep time), and how the users are geographically spread, you will likely end up looking at different metrics. However, below are some general tips to ensure you’re getting and interpreting the data you need.

Tip #1: In cases of very long user scenarios, it would be better to look at a single page or object rather than the “user load time” (i.e. the time it takes to load all pages within a user scenario excluding sleep times).

Tip #2: Even though “User Load Time” is a good indicator for identifying problems, it is better to dig in deeper by looking at individual pages or objects (URL) to get a more precise indication of where things have gone wrong. It may also be helpful to filter by geographic location as load times may vary depending on where the traffic is generated from.

Tip #3: If you have a test-configuration with a constant ramp-up and during that test the load time suddenly shoots through the roof, this is a likely sign that the system got overloaded a bit earlier than the results show. In order to gain a better understanding of how your system behaves under a certain amount of load, apply different steps in the test configuration to allow the system to calm down for approximately 15 minutes. By doing so, you will be able to obtain more and higher quality samples for your statistics.

Tip #4: If you notice load times are increasing and then suddenly starting to drop, then your service might be delivering errors with “200-OK” responses, which would indicate that something may have crashed in your system.

Tip #5: If you get an exponential (x²) curve, you might want to check on the bandwidth or requests-per-second. If it’s decreasing or not increasing as quickly as expected, this would indicate that there are issues on the server side (e.g. front end/app servers are overloaded). Or if it’s increasing to a certain point and then plateaus, you probably ran out of bandwidth.

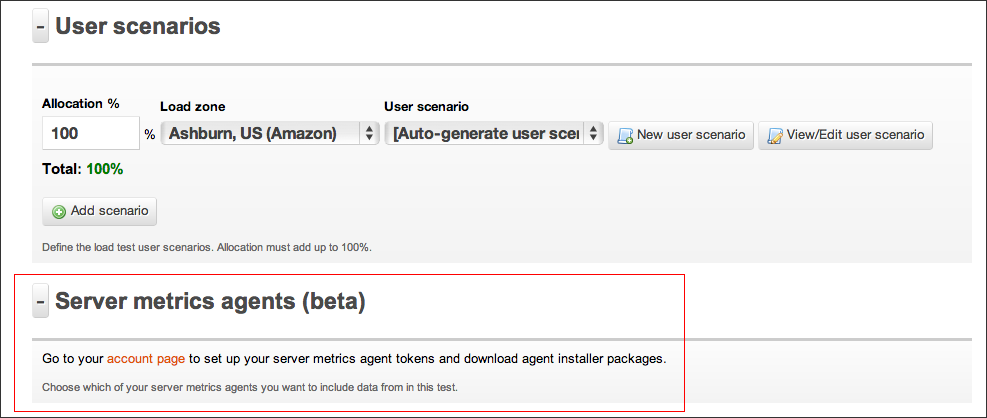
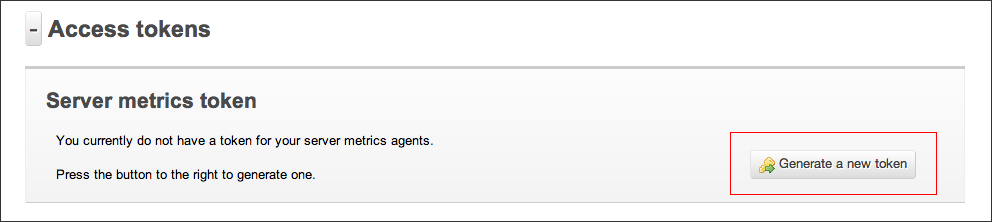
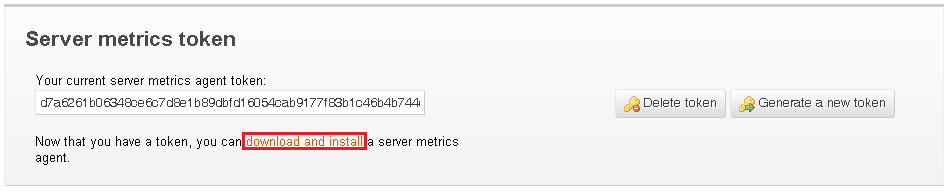
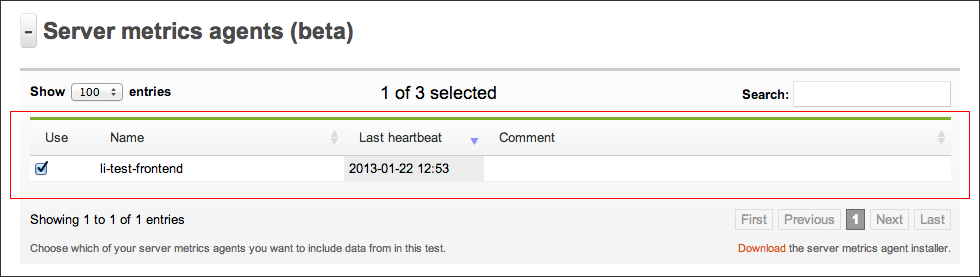
Tip #6: To easily identify the limiting factor(s) in your system, you can add a Server Metrics Agent which reports performance metrics data from your servers. Furthermore, you could possibly export or download the whole test data with information containing all the requests made during the tests, including the aggregated data, and then import and query via MySQL database, or whichever database you prefer.

In a nutshell, the ability to extrapolate information from load test reports allows you to understand and appreciate what is happening within your system. To reiterate, here are some key factors to bear in mind when analyzing load test results:

  • Check Bandwidth

  • Check load time for a single page rather than user load time

  • Check load times for static objects vs. dynamic objects

  • Check the failure rate

  • For Server Metrics – check CPU and Memory usage status

……………….


1e93082This article was written by Alex Bergvall, Performance Tester and Consultant at Load Impact. Alex is a professional tester with extensive experience in performance testing and load testing. His specialities include automated testing, technical function testing, functional testing, creating test cases, accessibility testing , benchmark testing, manual testing, etc.

Twitter: @AlexBergvall

Detect server side problems using Nagios plugins and the Load Impact Server Metrics Agent

Just recently we launched our cloud-based Server Metrics Agent – a function that allows you to collect information about what’s happening internally on your servers while your website or -application is being load tested. Installing the Server Metrics agent on one of your machines will immediately let you see how much CPU, memory and network bandwidth the server is using throughout the load test.

SMA

This can, of course, be very useful when looking for bottlenecks, but sometimes you want to know more. For example, you might be using a database software such as PostgreSQL and suspect that it is running out of some PostgreSQL– internal resource, such as client connections, causing a bottleneck for your web server in handling client requests. In this case, you will not notice any problems just by looking at, for example, the CPU or memory usage on the physical server where PostgreSQL is running. Instead, you must communicate directly with PostgreSQL and ask it how it’s doing. You want it to tell you how many connections its database clients are using and what the maximum limit is.

When we created our Server Metrics agent, we realized people would want to collect more specialized metrics like this. Not just the standard physical server metrics (e.g. CPU usage, memory usage, disk usage, etc) but we were confronted with a big problem; there are thousands of different systems, platforms, applications from which you might want to collect performance metrics in order to detect bottlenecks, and each of them communicates in different ways. We couldn’t possibly write monitoring code to support every one of them.

Luckily, we have a bit of experience with uptime monitoring, and we knew that the very popular open-source monitoring solution Nagios has a simple and flexible plugin system that is easy to interface with. We came up with the idea of designing our Server Metrics agent so that it was compatible with the Nagios plugin system, allowing users to use any Nagios plugins to collect performance data during their load tests.

As a result, Server Metrics allows you to collect performance metrics from almost anything! Measurements from the Server Metrics Agent can be correlated with other measurements collected during load tests, and results are made available as a time series that can also be viewed in graph format on the test results page, or exported to CSV (comma-separated values) format for use in a spreadsheet.

The Nagios community has created over 3,000 different plugins that measure the health of all kinds of software applications, hardware products, networks and services. And the plugins are available for all kinds of platforms (e.g. Linux, Windows, etc).

  1. Follow the instructions at https://loadimpact.com/server-metrics-agent-download to download, install and enable your server metrics agent

  1. Go to http://exchange.nagios.org/directory/Plugins and find the plugin(s) you want to use. In our case we wanted to monitor PostgreSQL so we go to http://exchange.nagios.org/directory/Plugins/Databases/PostgresQL which lists 18 (!) different plugins that can extract information about the health of a PostgreSQL server. We chose the “check_postgres” plugin – http://exchange.nagios.org/directory/Plugins/Databases/PostgresQL/check_postgres/details

  1. Download and install the check_postgres plugin (in our case we did it locally on our PostgreSQL server)

  1. Edit the configuration file for the server metrics agent – it is called “li_metrics_agent.conf” and look at the section in it that says “# An external script” for information about how to make the Server Metrics agent start using your new Nagios PostgreSQL plugin. In our case we added two lines that looked like this:

[db_connections]

command = /usr/bin/perl /path/to/check_postgres-2.11.1/check_postgres.pl –host=localhost –port=5432 –dbname=loadimpact –dbuser=postgres –dbpass=verysecret –action backends -w 5 -c 10

Tip: if you have installed a Nagios plugin but don’t know what parameters it needs, try executing it with the –help parameter

  1. Restart your Server Metrics agent

  1. As usual, you then enable Server Metrics data collection from this particular agent when you configure a load test

Tip: the agent name should be shown as a selectable Server Metrics agent in the test configuration interface. If it you do not see it listed, this means your agent hasn’t started or that it can’t reach loadimpact.com. The latter is often a firewall issue.
When the test starts, you will see the Server Metrics agent coming online in the console:

Then when the load test is running you will be able to plot the usual CPU, memory, disk, etc. statistics that the Server Metrics agent collects by default, but you will also have a new metric called whichever name the active database has that you are measuring client connections for (in this case, the database is called “loadimpact”):

So in this example, we choose to plot this metric, which will show us the current number of clients connected to the database “loadimpact” on the PostgreSQL database on the physical server “dbserver1”. The chart then looks like this:

The orange line shows the current number of connections to the database “loadimpact”, which in this example is around 80 and fairly stable.

This is, of course, just a simple example. The check_postgres plugin can measure a vast number of things related to your PostgreSQL database server. And anything it can measure you can have the Load Impact Server Metrics agent collect and relay to loadimpact.com to be stored as test result data associated with your load test. Many of the 3,000+ Nagios plugins are very powerful data collection programs, and by utilizing the Nagios plugin compatibility of Load Impact’s Server Metrics agent you suddenly have access to an incredibly wide range of measurement and monitoring options for load testing.

Server Metrics Tutorial

Here at Load Impact, we’re constantly developing new features to help make our load testing tool even more powerful and easy to use. Our latest feature, Server Metrics, now makes it possible for you to measure performance metrics from your own servers and integrate these metrics with the graphs generated from your Load Impact test. This makes it much easier for you to correlate data from your servers with test result data, while helping you identify the reasons behind possible performance problems in your site. We do this by installing agents on your servers in order to grab server metrics data, which we can later insert into the results graph.

Having been a pure online SaaS testing tool, we don’t like the hassle that downloads and setups bring, so we’ve tried to make it really simple to set this up and use. (After all, we are trying to make testing more efficient, not more frustrating!)

Here’s 5 steps on how you can get Server Metrics up to a flying start:

Step 1 (Optional): Check out where Server Metrics appears in your Test Configuration

Go ahead and Log In to your account, then select the Test Configuration tab and create a new configuration. Alternatively, if you have current test configurations already set up, select one. Below the “User Scenarios” subsection, you should now find a section named “ Server Metrics”.  Click on “Go to Your account page”.
Alternatively, skip this step altogether and head straight to “Access Tokens” under the “Account” tab.

Step 2: Generating a Token

In order to identify our agents when they are talking to Load Impact, we need an identification key. We refer to this as a token. To generate a token, follow the instructions as stated.
(Yes, you only have to click on the “Generate a new token” button. Once :P)

Step 3: Download and install Server Metrics agent

Now comes the hardest part. You’ll need to download and install our Server Metrics agent for your server platform. Installation should be as basic as following the instructions in our Wizard, on in the README file.

Step 4: Run your test!

Once the server metrics agent is configured, you’ll immediately be able to select it in your Test Configuration (see Step 1). We recommend giving a name that describes the name of the server you’re installing it on for easier identification later on. From here, just configure and run your test as per normal.

Step 5: Viewing Server Metrics in your test results

Once your test has started, you should be able to see your Server Metrics results in real time, just as with all of our other result graphs. Simply select the the kind(s) of server metrics you wish to view in the “Add Graph” drop down menu. This will plot the results for the specific server metric that you wish to view.

And that’s it! You’re all set towards easier bottleneck identification 🙂
For an example of how these graphs are can help make your load testing life easier, take a look at the test results below. These results show your server’s CPU usage as load is being increased on your website.

Don’t think this is simple enough? Email support [at] loadimpact [dot] com to let us know how we can do one better!

About Load Impact

Load Impact is the leading cloud-based load testing software trusted by over 123,000 website, mobile app and API developers worldwide.

Companies like JWT, NASDAQ, The European Space Agency and ServiceNow have used Load Impact to detect, predict, and analyze performance problems.
 
Load Impact requires no download or installation, is completely free to try, and users can start a test with just one click.
 
Test your website, app or API at loadimpact.com

Enter your email address to follow this blog and receive notifications of new posts by email.